The Upside of the Sequester - A Democratic Congress after 2014.

obama will manufacture the effects of sequester just like he released dangerous criminals before the sequester took effect. Either the public will believe that his deliberate acts are an ancillary effect of sequester or they will look at his 250 million to Egypt and 110 million to Libyan rebels and wonder what the fuck is this idiot thinking and punish the democrats in 2014.


Judge Andrew Napolitano has suggested that if BO is deliberately causing harm to the military and our national security -- when he certainly could send a second carrier to the Persian Gulf, but prefers to direct the budget cuts where they cause the most harm, and make news for political advantage -- he may be committing an impeachable offense.
 
62158_404968156252088_977909923_n.jpg
 
Here are the BLS replacement worker numbers.

Replacement needs

And here is what the BLS says about new jobs and replacement jobs.

You're citing the Employment Projections Program, which is a 10 year projection of Occupational Employment.

The monthly Employment Situation numbers do NOT consider replacements or anything of the sort, it's a simple net change. "New jobs" is simply a postive net change in total nonfarm payroll employment. There's not seperate categories for new or replacement.

You can derive some of that from the Job Openings Labor Turnover Survey, Business Employment Dynamics, and the experimental series of Labor Force Flows, but no, BLS does NOT keep seperate track of new and replacement jobs.

Proof: Current Employment Statistics Manufacturing Report FormThis is the survey form used for the monthly survey to measure jobs. I've linked to the Manufacturing form, the others are available at IDCF Forms

Notice that there are NO questions about replacements or new etc..just a count of number of employees.
I never said that replacement workers was a separate category in the monthly report. In fact, I told him in another post you had to derive it from the BLS info supplied. He was claiming there was no such thing as a replacement worker as far as the BLS was concerned.

And he's right as far as the calculations of Employment are concerned. Estimation of replacements is only used for the Employment Projections...there's no specific category or count.
 
Here are the BLS replacement worker numbers.

Replacement needs

And here is what the BLS says about new jobs and replacement jobs.

You're citing the Employment Projections Program, which is a 10 year projection of Occupational Employment.

The monthly Employment Situation numbers do NOT consider replacements or anything of the sort, it's a simple net change. "New jobs" is simply a postive net change in total nonfarm payroll employment. There's not seperate categories for new or replacement.

You can derive some of that from the Job Openings Labor Turnover Survey, Business Employment Dynamics, and the experimental series of Labor Force Flows, but no, BLS does NOT keep seperate track of new and replacement jobs.

Proof: Current Employment Statistics Manufacturing Report FormThis is the survey form used for the monthly survey to measure jobs. I've linked to the Manufacturing form, the others are available at IDCF Forms

Notice that there are NO questions about replacements or new etc..just a count of number of employees.
I never said that replacement workers was a separate category in the monthly report. In fact, I told him in another post you had to derive it from the BLS info supplied. He was claiming there was no such thing as a replacement worker as far as the BLS was concerned.

now look who's putting words in someones elses mouth now. :rolleyes:


This started months ago, in the last long UE report and labor participation rate thread where in when you claimed that retirees were bloating the lpr number and that their jobs were being filled. I asked to see those numbers...and have been asking.

My question on that point was/is- where the workers who took those jobs, were that number is, were is it reflected to back up the retiree replacement claim...... exactly and what the number is, exactly.
 
One better hope the Dems don't win the House. They will have the whole pie then. I don't like it when one party has the whole pie.

When they had a super majority we got gifted with Obamacare. another costly entitlement we cannot afford. Who knows what else those idiot Dems will pass if they have both the House and the Senate?

Oh and BTW wasn't the sequester BO's idea?? Seems funny that he's now saying its the fault of Congress?

Yeah. He's a winner all right.

Mitt says that BO is running around campaigning and not working with Repubs on the sequester because his REAL goal is getting back the House in '14, so he can have total "run of the field", aka dictatorial control. If he'd really been concerned with doing his job, he'd have invited Repubs into the WH to hash it out, but instead he runs around the nation demonizing Repubs and blaming Repubs for HIS sequester, which only makes Repubs retrench, and angry.

It's not how a real leader or CEO operates, but then all BO has ever been is a local community agitator, never a CEO or leader of any kind, and his business/economic experience is exactly ZERO.

They were at the WH, but the Republicans refuse to compromise or respect the election results. It's time for them to join the Whigs.
 
Here are the BLS replacement worker numbers.

Replacement needs

And here is what the BLS says about new jobs and replacement jobs.

alright thank you.

I don't see ( category? ) for numbers for workers no longer unemployed due to having replaced a worker who has left their job due to retirement? :eusa_eh:
You have to calculate it yourself from the numbers the BLS supplies. Is that beyond your mathematical abilities?

You're citing the Employment Projections Program, which is a 10 year projection of Occupational Employment.

The monthly Employment Situation numbers do NOT consider replacements or anything of the sort, it's a simple net change. "New jobs" is simply a postive net change in total nonfarm payroll employment. There's not seperate categories for new or replacement.

You can derive some of that from the Job Openings Labor Turnover Survey, Business Employment Dynamics, and the experimental series of Labor Force Flows, but no, BLS does NOT keep seperate track of new and replacement jobs.

Proof: Current Employment Statistics Manufacturing Report FormThis is the survey form used for the monthly survey to measure jobs. I've linked to the Manufacturing form, the others are available at IDCF Forms

Notice that there are NO questions about replacements or new etc..just a count of number of employees.
I never said that replacement workers was a separate category in the monthly report. In fact, I told him in another post you had to derive it from the BLS info supplied. He was claiming there was no such thing as a replacement worker as far as the BLS was concerned.

now look who's putting words in someones elses mouth now. :rolleyes:


This started months ago, in the last long UE report and labor participation rate thread where in when you claimed that retirees were bloating the lpr number and that their jobs were being filled. I asked to see those numbers...and have been asking.

My question on that point was/is- where the workers who took those jobs, were that number is, were is it reflected to back up the retiree replacement claim...... exactly and what the number is, exactly.
You're making shit up again, but at least you admit you lack the mathematical skills to derive the number form what BLS supplies.


I gave you the number of new SS awards for the month and year from this source:
Social Security award data
Then I gave you the AARP study that found that 54% have retired by age 65. Do the math and you get how many retirees leave the workforce monthly or yearly.
Then from the BLS link you get the estimate for the number of replacement workers needed for the next decade based on the number of actual replacement workers from the previous 5 years. So the 33.7 million replacement workers needed for the period 2010 to 2020 gives a yearly need of 3.37 million and a monthly need of nearly 100,000. Pretty close to the 122,000 average retirees leaving the workforce from the SS award data and AARP study. If you remember I pointed out that not every job left by a retiree gets filled, but I said it is conservatively safe to aproximate that 100,000 retiree jobs get replaced by the unemployed or new entrants to the workforce every month IN ADDITION to the number of NEW jobs created each month.


Every time I give you this info you run away and then demand it in another thread only to run away again. I'm tired of indulging such a child as you, so this is the last time I'm going through it with you.


Estimating Occupational Replacement Needs


Developing historical replacement rates

To develop estimates of replacements, the BLS used occupational employment data from the Current Population Survey (CPS), a household survey that collects demographic and employment information about individuals. BLS analysts measured the net change in occupational employment for 13 different age cohorts over a 5-year period.(1) For each occupation, employment data for each age group in 2005 were compared with corresponding data for the group in 2010. Looking at the older group in 2010 is necessary in order to follow the cohort of workers as they age over the 5 years of the study. For example, the number of financial managers aged 20 to 24 years in 2005 was compared with the number of financial managers aged 25 to 29 years in 2010. (See table 1.) The larger employment in 2010 indicated that there were more entrants than separations among individuals aged 20 to 24 years in 2005. The net entrants were recorded as a positive net change for this cohort. Employment of financial managers in the cohort aged 50 to 54 years in 2005, however, showed a decline. Declines in employment for an age cohort measure net separations; increases measure net entrants.
After calculating net change by age cohort, BLS analysts estimated historical replacement needs. Replacement needs were equal to net separations unless employment declined between 2005 and 2010. In these cases, declines in employment were subtracted from the net separations because not all workers who left the occupation were replaced. For each age group, replacement needs were divided by 2005 employment to calculate a historical 5-year replacement rate.
Developing projected replacement rates

Historical replacement rates were used to estimate replacement needs during the 2010–20 decade. First, replacement needs were calculated for the 2010–15 period. Then employment was estimated for 2015 by applying the cohort’s historical rate of change to its 2010 employment. Next, the 2015 employment figure was multiplied by the historical replacement rate to calculate replacement needs for the 2015–20 time span. Finally, projected replacement needs for each 5-year period were summed to compute 10-year replacement needs for each occupation.
 
Last edited:
alright thank you.

I don't see ( category? ) for numbers for workers no longer unemployed due to having replaced a worker who has left their job due to retirement? :eusa_eh:
You have to calculate it yourself from the numbers the BLS supplies. Is that beyond your mathematical abilities?

I never said that replacement workers was a separate category in the monthly report. In fact, I told him in another post you had to derive it from the BLS info supplied. He was claiming there was no such thing as a replacement worker as far as the BLS was concerned.

now look who's putting words in someones elses mouth now. :rolleyes:


This started months ago, in the last long UE report and labor participation rate thread where in when you claimed that retirees were bloating the lpr number and that their jobs were being filled. I asked to see those numbers...and have been asking.

My question on that point was/is- where the workers who took those jobs, were that number is, were is it reflected to back up the retiree replacement claim...... exactly and what the number is, exactly.
You're making shit up again, but at least you admit you lack the mathematical skills to derive the number form what BLS supplies.


I gave you the number of new SS awards for the month and year from this source:
Social Security award data
Then I gave you the AARP study that found that 54% have retired by age 65. Do the math and you get how many retirees leave the workforce monthly or yearly.
Then from the BLS link you get the estimate for the number of replacement workers needed for the next decade based on the number of actual replacement workers from the previous 5 years. So the 33.7 million replacement workers needed for the period 2010 to 2020 gives a yearly need of 3.37 million and a monthly need of nearly 100,000. Pretty close to the 122,000 average retirees leaving the workforce from the SS award data and AARP study. If you remember I pointed out that not every job left by a retiree gets filled, but I said it is conservatively safe to aproximate that 100,000 retiree jobs get replaced by the unemployed or new entrants to the workforce every month IN ADDITION to the number of NEW jobs created each month.


Every time I give you this info you run away and then demand it in another thread only to run away again. I'm tired of indulging such a child as you, so this is the last time I'm going through it with you.


Estimating Occupational Replacement Needs


Developing historical replacement rates

To develop estimates of replacements, the BLS used occupational employment data from the Current Population Survey (CPS), a household survey that collects demographic and employment information about individuals. BLS analysts measured the net change in occupational employment for 13 different age cohorts over a 5-year period.(1) For each occupation, employment data for each age group in 2005 were compared with corresponding data for the group in 2010. Looking at the older group in 2010 is necessary in order to follow the cohort of workers as they age over the 5 years of the study. For example, the number of financial managers aged 20 to 24 years in 2005 was compared with the number of financial managers aged 25 to 29 years in 2010. (See table 1.) The larger employment in 2010 indicated that there were more entrants than separations among individuals aged 20 to 24 years in 2005. The net entrants were recorded as a positive net change for this cohort. Employment of financial managers in the cohort aged 50 to 54 years in 2005, however, showed a decline. Declines in employment for an age cohort measure net separations; increases measure net entrants.
After calculating net change by age cohort, BLS analysts estimated historical replacement needs. Replacement needs were equal to net separations unless employment declined between 2005 and 2010. In these cases, declines in employment were subtracted from the net separations because not all workers who left the occupation were replaced. For each age group, replacement needs were divided by 2005 employment to calculate a historical 5-year replacement rate.
Developing projected replacement rates

Historical replacement rates were used to estimate replacement needs during the 2010–20 decade. First, replacement needs were calculated for the 2010–15 period. Then employment was estimated for 2015 by applying the cohort’s historical rate of change to its 2010 employment. Next, the 2015 employment figure was multiplied by the historical replacement rate to calculate replacement needs for the 2015–20 time span. Finally, projected replacement needs for each 5-year period were summed to compute 10-year replacement needs for each occupation.

bzxh11

so, there is no bls calculation ......this 100.000 number is a number you are calculating for jobs now opened due to retiree turn over and an employment of a here to fore unemployed person? And the BLS doesn't capture that?


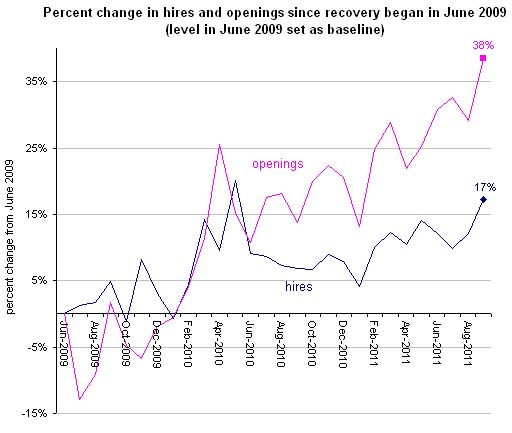
what do you think of this chart btw-

economix-08jolts-custom2.jpg


and I didn't make anything up ed, I have asked you the same questions based on the same argument. you know it, I know it.

You are saying that there are folks who are unemployed, who then become employed, and they come off "a" unemployed count/number, but cannot surface a bls document with numbers saying- there has been such and such number of openings, due to separation (ex; retirees) and such a number of hires that gets captured here______ for a number. I find it very difficult to believe the bls et all does not capture this, it seems a bit crazy for an agency that seems to quantify ( or attempt to quantify) everything....so, I have to say this all seems like a mish mash.

If I produced this for you as back up to a claim of mine, you would not accept it and I would not expect you to.
 
You have to calculate it yourself from the numbers the BLS supplies. Is that beyond your mathematical abilities?

now look who's putting words in someones elses mouth now. :rolleyes:


This started months ago, in the last long UE report and labor participation rate thread where in when you claimed that retirees were bloating the lpr number and that their jobs were being filled. I asked to see those numbers...and have been asking.

My question on that point was/is- where the workers who took those jobs, were that number is, were is it reflected to back up the retiree replacement claim...... exactly and what the number is, exactly.
You're making shit up again, but at least you admit you lack the mathematical skills to derive the number form what BLS supplies.


I gave you the number of new SS awards for the month and year from this source:
Social Security award data
Then I gave you the AARP study that found that 54% have retired by age 65. Do the math and you get how many retirees leave the workforce monthly or yearly.
Then from the BLS link you get the estimate for the number of replacement workers needed for the next decade based on the number of actual replacement workers from the previous 5 years. So the 33.7 million replacement workers needed for the period 2010 to 2020 gives a yearly need of 3.37 million and a monthly need of nearly 100,000. Pretty close to the 122,000 average retirees leaving the workforce from the SS award data and AARP study. If you remember I pointed out that not every job left by a retiree gets filled, but I said it is conservatively safe to aproximate that 100,000 retiree jobs get replaced by the unemployed or new entrants to the workforce every month IN ADDITION to the number of NEW jobs created each month.


Every time I give you this info you run away and then demand it in another thread only to run away again. I'm tired of indulging such a child as you, so this is the last time I'm going through it with you.


Estimating Occupational Replacement Needs


Developing historical replacement rates

To develop estimates of replacements, the BLS used occupational employment data from the Current Population Survey (CPS), a household survey that collects demographic and employment information about individuals. BLS analysts measured the net change in occupational employment for 13 different age cohorts over a 5-year period.(1) For each occupation, employment data for each age group in 2005 were compared with corresponding data for the group in 2010. Looking at the older group in 2010 is necessary in order to follow the cohort of workers as they age over the 5 years of the study. For example, the number of financial managers aged 20 to 24 years in 2005 was compared with the number of financial managers aged 25 to 29 years in 2010. (See table 1.) The larger employment in 2010 indicated that there were more entrants than separations among individuals aged 20 to 24 years in 2005. The net entrants were recorded as a positive net change for this cohort. Employment of financial managers in the cohort aged 50 to 54 years in 2005, however, showed a decline. Declines in employment for an age cohort measure net separations; increases measure net entrants.
After calculating net change by age cohort, BLS analysts estimated historical replacement needs. Replacement needs were equal to net separations unless employment declined between 2005 and 2010. In these cases, declines in employment were subtracted from the net separations because not all workers who left the occupation were replaced. For each age group, replacement needs were divided by 2005 employment to calculate a historical 5-year replacement rate.
Developing projected replacement rates

Historical replacement rates were used to estimate replacement needs during the 2010–20 decade. First, replacement needs were calculated for the 2010–15 period. Then employment was estimated for 2015 by applying the cohort’s historical rate of change to its 2010 employment. Next, the 2015 employment figure was multiplied by the historical replacement rate to calculate replacement needs for the 2015–20 time span. Finally, projected replacement needs for each 5-year period were summed to compute 10-year replacement needs for each occupation.

so, there is no bls calculation ......this 100.000 number is a number you are calculating for jobs now opened due to retiree turn over and an employment of a here to fore unemployed person? And the BLS doesn't capture that?


what do you think of this chart btw-

economix-08jolts-custom2.jpg


and I didn't make anything up ed, I have asked you the same questions based on the same argument. you know it, I know it.

You are saying that there are folks who are unemployed, who then become employed, and they come off "a" unemployed count/number, but cannot surface a bls document with numbers saying- there has been such and such number of openings, due to separation (ex; retirees) and such a number of hires that gets captured here______ for a number. I find it very difficult to believe the bls et all does not capture this, it seems a bit crazy for an agency that seems to quantify ( or attempt to quantify) everything....so, I have to say this all seems like a mish mash.

If I produced this for you as back up to a claim of mine, you would not accept it and I would not expect you to.
Here you are again trying to claim that retirees do not open up jobs for replacement workers. BLS says they do not track retired, which is why you have to deduce it yourself from available data, something obviously beyond your ability.

And for your information, according to BLS, separations includes a lot more than just retirees. Retirees are part of "other" separations, but BLS does not break down totals for each of the "others." Clearly there are enough "others" to support the numbers I use for retirees, so I am at least feasibly in the ball park even though BLS does not track retirees. At the very least, nothing the BLS provides directly contradicts my approximations!
Table 6. Other separations levels and rates by industry and region, seasonally adjusted

Job Openings and Labor Turnover Summary


Separations The total separations figure includes quits, layoffs and discharges, and other separations. Total separations also is referred to as turnover. Quits are generally voluntary separations initiated by the employee. Therefore, the quits rate can serve as a measure of workers’ willingness or ability to leave jobs. Layoffs and discharges are involuntary separations initiated by the employer. Other separations include separations due to retirement, death, and disability, as well as transfers to other locations of the same firm.
 
Last edited:
You haven't a clue.......

So, what I said was untrue? So tell me where I was wrong. How was Vietnam a threat to the security of the USA? How is Afghanistan a threat to the security of the USA? Do you deny that republicans worry more about tax breaks for the very wealthy than they worry about the needy?

How much have you donated to the needy? My bet is that you won't catch up to me in 20 years.... Yes we worry about the needy, But the dollars i give do a lot more good than if I gave it to the IRS.

You haven't answered the question about how Afghanistan was a threat or Vietnam for that matter. The Afghanis hiding UBL doesn't justify a ten year trillion dollar war. Tell me about their capabilities of harming USA if you can.
 
Has anyone older than 40 ever seen such a freaking bunch of whiners as the current a-holes in the democrat party? I think I might puke if I hear them complain one more time about the unfairness of only controlling 2/3 of the government. The senate majority leader's strategy was simple enough, do nothing. As a matter of fact it has always been his strategy. The president thought he could bluff the citizens but he only bluffed the ignorant true believers and he came off as a whiny petulant lying SOB.

Democrats only control 1/4. The presidency. . The repubs run the senate due to the supermajority rule. They run the congress . The supreme court is 5-4 republican majority.
I consider the supreme courty part of the mix due to their activism. Things have never been better for republicans considering the man in the white house is willing to cut entitlements at the drop of a hat.
 
Last edited:
All of this partisan bikering is bullocks. I really DO WISH the democrats would win the congress at mid-terms. Then the American people would squarely place blame where it belongs when the dollar finally loses all it's value. But in order to do this, the opposition party would have to make a stand, but they won't. Why? Because they are as corrupt and bought off by the corporate powers and banking cabal as the democrats are, and all Americans know it.


All Of This Whining And Crying About The Sequester Shows Why America Is Doomed
http://theeconomiccollapseblog.com/archives/all-of-this-whining-and-crying-about-the-sequester-shows-why-america-is-doomed
If you want to get upset about something, why not get upset about things that are increasing our debt by trillions of dollars?

For example, according to a Government Accountability Office report that was just released, Obamacare is going to cause the federal debt to rise by $6.2 trillion.

Why aren't more people getting upset over that?

Sadly, it is because America is a debt addict. Most Americans don't really care much when federal spending skyrockets out of control, but if anyone tries to slow down the spending a little bit they throw hissy fits.

And please don't tell me that "the big government Republicans" are much better than "the big government Democrats" on budget issues. The Republicans have caved in and have gone along with all of this wild spending every single time.

On March 27th, they will have another opportunity to do something. That is when the current continuing resolution expires.

At that time, the Republicans could refuse to pass anything but a balanced budget.

Or they could at least refuse to pass anything except a budget that would cut the federal budget deficit in half.

But they won't do anything once again. They will cave in and go along with the status quo because they are cowards.

Who here wants to bet they will cave? I'll bet. I'll never come back if they stand their ground. If they cave, you leave and never come back. Not a soul is willing to take that bet, you know why? Because they are all corrupt and lacking principles, and you all damn well know it. Not one of them will stand for the people of this nation, not since Paul left, they stand for the banking cabal and big business.
 
So, what I said was untrue? So tell me where I was wrong. How was Vietnam a threat to the security of the USA? How is Afghanistan a threat to the security of the USA? Do you deny that republicans worry more about tax breaks for the very wealthy than they worry about the needy?

How much have you donated to the needy? My bet is that you won't catch up to me in 20 years.... Yes we worry about the needy, But the dollars i give do a lot more good than if I gave it to the IRS.

You haven't answered the question about how Afghanistan was a threat or Vietnam for that matter. The Afghanis hiding UBL doesn't justify a ten year trillion dollar war. Tell me about their capabilities of harming USA if you can.

Actually we sort of agree there. I believe that we had to go into Afghanistan, just as we had to go into Iraq, and in both wars our military performed perfectly. It was the politicians who dragged them out and were totally wrong. We should have been in and out of both places within a year, 2 at the outside.
 
You're making shit up again, but at least you admit you lack the mathematical skills to derive the number form what BLS supplies.


I gave you the number of new SS awards for the month and year from this source:
Social Security award data
Then I gave you the AARP study that found that 54% have retired by age 65. Do the math and you get how many retirees leave the workforce monthly or yearly.
Then from the BLS link you get the estimate for the number of replacement workers needed for the next decade based on the number of actual replacement workers from the previous 5 years. So the 33.7 million replacement workers needed for the period 2010 to 2020 gives a yearly need of 3.37 million and a monthly need of nearly 100,000. Pretty close to the 122,000 average retirees leaving the workforce from the SS award data and AARP study. If you remember I pointed out that not every job left by a retiree gets filled, but I said it is conservatively safe to aproximate that 100,000 retiree jobs get replaced by the unemployed or new entrants to the workforce every month IN ADDITION to the number of NEW jobs created each month.


Every time I give you this info you run away and then demand it in another thread only to run away again. I'm tired of indulging such a child as you, so this is the last time I'm going through it with you.


Estimating Occupational Replacement Needs


Developing historical replacement rates

To develop estimates of replacements, the BLS used occupational employment data from the Current Population Survey (CPS), a household survey that collects demographic and employment information about individuals. BLS analysts measured the net change in occupational employment for 13 different age cohorts over a 5-year period.(1) For each occupation, employment data for each age group in 2005 were compared with corresponding data for the group in 2010. Looking at the older group in 2010 is necessary in order to follow the cohort of workers as they age over the 5 years of the study. For example, the number of financial managers aged 20 to 24 years in 2005 was compared with the number of financial managers aged 25 to 29 years in 2010. (See table 1.) The larger employment in 2010 indicated that there were more entrants than separations among individuals aged 20 to 24 years in 2005. The net entrants were recorded as a positive net change for this cohort. Employment of financial managers in the cohort aged 50 to 54 years in 2005, however, showed a decline. Declines in employment for an age cohort measure net separations; increases measure net entrants.
After calculating net change by age cohort, BLS analysts estimated historical replacement needs. Replacement needs were equal to net separations unless employment declined between 2005 and 2010. In these cases, declines in employment were subtracted from the net separations because not all workers who left the occupation were replaced. For each age group, replacement needs were divided by 2005 employment to calculate a historical 5-year replacement rate.
Developing projected replacement rates

Historical replacement rates were used to estimate replacement needs during the 2010–20 decade. First, replacement needs were calculated for the 2010–15 period. Then employment was estimated for 2015 by applying the cohort’s historical rate of change to its 2010 employment. Next, the 2015 employment figure was multiplied by the historical replacement rate to calculate replacement needs for the 2015–20 time span. Finally, projected replacement needs for each 5-year period were summed to compute 10-year replacement needs for each occupation.

so, there is no bls calculation ......this 100.000 number is a number you are calculating for jobs now opened due to retiree turn over and an employment of a here to fore unemployed person? And the BLS doesn't capture that?


what do you think of this chart btw-

economix-08jolts-custom2.jpg


and I didn't make anything up ed, I have asked you the same questions based on the same argument. you know it, I know it.

You are saying that there are folks who are unemployed, who then become employed, and they come off "a" unemployed count/number, but cannot surface a bls document with numbers saying- there has been such and such number of openings, due to separation (ex; retirees) and such a number of hires that gets captured here______ for a number. I find it very difficult to believe the bls et all does not capture this, it seems a bit crazy for an agency that seems to quantify ( or attempt to quantify) everything....so, I have to say this all seems like a mish mash.

If I produced this for you as back up to a claim of mine, you would not accept it and I would not expect you to.


Here you are again trying to claim that retirees do not open up jobs for replacement workers. BLS says they do not track retired, which is why you have to deduce it yourself from available data, something obviously beyond your ability.

your ability to read what I write is, well, not good.

I didn't claim a thing.

I said-

You are saying that there are folks who are unemployed, .....yada yada yada...

And for your information, according to BLS, separations includes a lot more than just retirees. Retirees are part of "other" separations, but BLS does not break down totals for each of the "others." Clearly there are enough "others" to support the numbers I use for retirees, so I am at least feasibly in the ball park even though BLS does not track retirees. At the very least, nothing the BLS provides directly contradicts my approximations!
Table 6. Other separations levels and rates by industry and region, seasonally adjusted

Job Openings and Labor Turnover Summary


Separations The total separations figure includes quits, layoffs and discharges, and other separations. Total separations also is referred to as turnover. Quits are generally voluntary separations initiated by the employee. Therefore, the quits rate can serve as a measure of workers’ willingness or ability to leave jobs. Layoffs and discharges are involuntary separations initiated by the employer. Other separations include separations due to retirement, death, and disability, as well as transfers to other locations of the same firm.

yes indeed that page and tables are very interesting.

see my bold above as to your comment-

And for your information, according to BLS, separations includes a lot more than just retirees.


yes, I see that, which means that your argument as to retirees being a very large set and one of the largest drivers of the lower lpr and that that has led to pick ups in employment/ pick ups/new hires for those positions doesn't appear to be verifiable.

I am glad you feel that you were not contradicted, last I checked though, not being contradicted because there is no data to disprove ( or prove) your claim doesn't equate to anything but supposition.
 
so, there is no bls calculation ......this 100.000 number is a number you are calculating for jobs now opened due to retiree turn over and an employment of a here to fore unemployed person? And the BLS doesn't capture that?


what do you think of this chart btw-

economix-08jolts-custom2.jpg


and I didn't make anything up ed, I have asked you the same questions based on the same argument. you know it, I know it.

You are saying that there are folks who are unemployed, who then become employed, and they come off "a" unemployed count/number, but cannot surface a bls document with numbers saying- there has been such and such number of openings, due to separation (ex; retirees) and such a number of hires that gets captured here______ for a number. I find it very difficult to believe the bls et all does not capture this, it seems a bit crazy for an agency that seems to quantify ( or attempt to quantify) everything....so, I have to say this all seems like a mish mash.

If I produced this for you as back up to a claim of mine, you would not accept it and I would not expect you to.


your ability to read what I write is, well, not good.

I didn't claim a thing.

I said-

You are saying that there are folks who are unemployed, .....yada yada yada...

And for your information, according to BLS, separations includes a lot more than just retirees. Retirees are part of "other" separations, but BLS does not break down totals for each of the "others." Clearly there are enough "others" to support the numbers I use for retirees, so I am at least feasibly in the ball park even though BLS does not track retirees. At the very least, nothing the BLS provides directly contradicts my approximations!
Table 6. Other separations levels and rates by industry and region, seasonally adjusted

Job Openings and Labor Turnover Summary


Separations The total separations figure includes quits, layoffs and discharges, and other separations. Total separations also is referred to as turnover. Quits are generally voluntary separations initiated by the employee. Therefore, the quits rate can serve as a measure of workers’ willingness or ability to leave jobs. Layoffs and discharges are involuntary separations initiated by the employer. Other separations include separations due to retirement, death, and disability, as well as transfers to other locations of the same firm.
yes indeed that page and tables are very interesting.

see my bold above as to your comment-

And for your information, according to BLS, separations includes a lot more than just retirees.


yes, I see that, which means that your argument as to retirees being a very large set and one of the largest drivers of the lower lpr and that that has led to pick ups in employment/ pick ups/new hires for those positions doesn't appear to be verifiable.

I am glad you feel that you were not contradicted, last I checked though, not being contradicted because there is no data to disprove ( or prove) your claim doesn't equate to anything but supposition.
First of all, learn how to use the quote function properly.


Second, stop making up Straw Men as "my" argument.


And thirdly the number of "others" being greater than my approximation of retirees supports the reasoning behind it, which is clearly beyond your comprehension. Now if the number of "others" was less you would have a valid point, but that is not the case.


BLS clearly says that replacement jobs are an addition to job growth and both are filled by the unemployed and new entrants to the workforce. You have to fill all the replacement jobs before you get a count of new jobs.


Your moronic "logic" that if the BLS does not count retirees separately, then they can't influence either the LPR or the number of unemployed or employed is ridiculous!!!
 
Last edited:
obama will manufacture the effects of sequester just like he released dangerous criminals before the sequester took effect. Either the public will believe that his deliberate acts are an ancillary effect of sequester or they will look at his 250 million to Egypt and 110 million to Libyan rebels and wonder what the fuck is this idiot thinking and punish the democrats in 2014.


Judge Andrew Napolitano has suggested that if BO is deliberately causing harm to the military and our national security -- when he certainly could send a second carrier to the Persian Gulf, but prefers to direct the budget cuts where they cause the most harm, and make news for political advantage -- he may be committing an impeachable offense.

What hasn't he done that you folks DON'T consider an "impeachable offense".

:lol:
 
Well, I correctly predicted that the ACA decision assured President Obama a second term. Welp...this will assure a Democratic majority in both houses of congress.

You can take that to the bank.

:cool:

Far out- And could this all please happen at the cost of my paycheck?

Pay more taxes- The majority likes it

-Geaux

How much you pullin in a year?
 

Forum List

Back
Top