Old Rocks
Diamond Member
The sea ice in the arctic controls much of our climate, as we are seeing this winter.
Follow along with the video below to see how to install our site as a web app on your home screen.

Note: This feature currently requires accessing the site using the built-in Safari browser.
I don't care

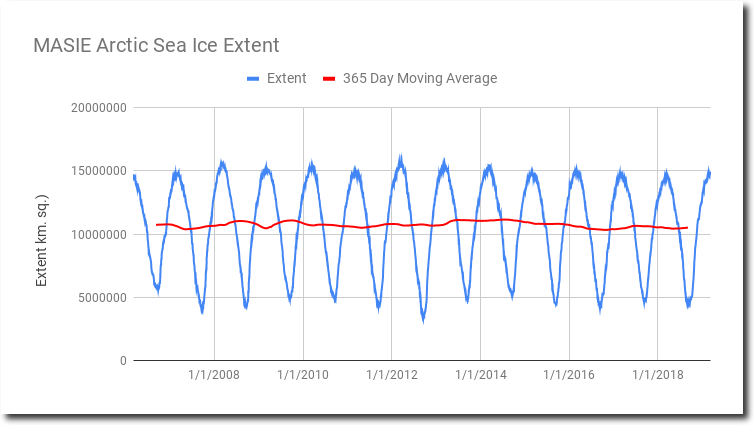
There has been no trend in arctic sea ice for 13 years...

There has been no trend in arctic sea ice for 13 years...
5 million square kilometers per division, which is certainly required to show the entire seasonal variation. But you need to wonder why they felt a need to show the seasonal variation.
View attachment 250203 NSIDC.org
500,000 square kilometers per division.
Hmmmm....
You post that graph up about 17 times each month for the past 8 or 9 years. But to what end? Outside of internet message boards, who is caring?
By the way.....that graph doesn't square with satellite photos at all which showed a huge expansion of the Arctic ice between 2012 and 2013. Oh that's right.......doesn't conform with the established narrative so didn't pay attention to that little factoid!
That bullshit graph is nothing more than a fine example of alarmist cherry picking...here is a longer view...it shows the arctic ice is higher at present than it has been for most of the past 10,000 years...

There has been no trend in arctic sea ice for 13 years...
5 million square kilometers per division, which is certainly required to show the entire seasonal variation. But you need to wonder why they felt a need to show the seasonal variation.
View attachment 250203 NSIDC.org
500,000 square kilometers per division.
Hmmmm....
Always trying to promote the short view because that is the only thing that appears to support your bullshit claims...here, have a look at the longer view and tell us some more about how the sky is falling...
