Peer reviewed paper shows no warming for at least 20 years.

Ummmm, sure it did. Here is a graph from the AGW cultists you quote with diarhetic regularity...Note how there is all this heat in the oceans (that Trenberth can't seem to find, it's hiding down there somewhere in violation of all physical laws we know of, but it's down there) and the other graph is from ARGO. You'll notice the actual empirical data shows a slight decline in the oceans temp. Not some fanciful "I can't find the missing energy in the oceans because my damned dog at it" bullshit.
Dishonest CON$ always use the data from the defective ARGO floats, long after the defective floats were discovered and the problem corrected, that misread the depth and were recording temperatures at depths much deeper than their sensors recorded giving cooler temperatures.

Here is a chart from the journal Nature of the real ARGO data from floats reading the correct depth.

CGD 2010 Profiles in Science: Dr. Kevin Trenberth

Trenberth, K.E. and J.T. Fasullo. 2010: Global Change: The ocean is warming, isn't it? Nature, 465, 304-304, doi:10.1038/465304a.
trenberth2t.jpg


Figure 2: High resolution figure
A reappraisal of the messy data on upper-ocean heat content for 1993–2008 provides clear evidence for warming. But differences among various analyses and inconsistencies with other indicators merit attention.
Global atmospheric temperatures at Earth's surface are often taken as an indicator of global warming. Yet the atmosphere is battered by all sorts of natural variability associated with weather phenomena. More robust indicators of a warming planet come from evidence of increasing ocean heat content and associated sea-level rise. Yet observing systems that capitalize on these insights are in their infancy. On page 334 of this issue, a step forward is reported by Lyman et al.1 — they find a robust warming of the global upper ocean to be present in the data, in spite of considerable uncertainties arising from the observations themselves.


Figure caption: Changing heat content of the global ocean, with respect to the mean of 1993 to 2008.

465304a-f1.2.jpg


Here's what NOAA has to say about your little graphs.


http://www.cpc.ncep.noaa.gov/products/analysis_monitoring/enso_update/gsstanim.gif

Dumb ass, that is current Enso conditions.
 
http://www.nature.com/nature/journal/v465/n7296/full/nature09043.html

Robust warming of the global upper ocean
John M. Lyman,1, 2 Simon A. Good,3 Viktor V. Gouretski,4 Masayoshi Ishii,5, 6 Gregory C. Johnson,2 Matthew D. Palmer,3 Doug M. Smith3 & Josh K. Willis7

A large (~1023 J) multi-decadal globally averaged warming signal in the upper 300 m of the world’s oceans was reported roughly a decade ago1 and is attributed to warming associated with anthropogenic greenhouse gases2, 3. The majority of the Earth’s total energy uptake during recent decades has occurred in the upper ocean3, but the underlying uncertainties in ocean warming are unclear, limiting our ability to assess closure of sea-level budgets4, 5, 6, 7, the global radiation imbalance8 and climate models5. For example, several teams have recently produced different multi-year estimates of the annually averaged global integral of upper-ocean heat content anomalies (hereafter OHCA curves) or, equivalently, the thermosteric sea-level rise5, 9, 10, 11, 12, 13, 14, 15, 16. Patterns of interannual variability, in particular, differ among methods. Here we examine several sources of uncertainty that contribute to differences among OHCA curves from 1993 to 2008, focusing on the difficulties of correcting biases in expendable bathythermograph (XBT) data. XBT data constitute the majority of the in situ measurements of upper-ocean heat content from 1967 to 2002, and we find that the uncertainty due to choice of XBT bias correction dominates among-method variability in OHCA curves during our 1993–2008 study period. Accounting for multiple sources of uncertainty, a composite of several OHCA curves using different XBT bias corrections still yields a statistically significant linear warming trend for 1993–2008 of 0.64 W m-2 (calculated for the Earth’s entire surface area), with a 90-per-cent confidence interval of 0.53–0.75 W m-2
 
Ocean greenery under warming stress : Nature News

Ocean greenery under warming stress
A century of phytoplankton decline suggests that ocean ecosystems are in peril.

Quirin Schiermeier


Since 1950, phytoplankton in the world's oceans have declined by 40%.Karl Bruun, Nostoca Algae Laboratory. Courtesy of Nikon Small WorldMarine phytoplankton — the vast range of tiny algae species accounting for roughly half of Earth's total photosynthetic biomass — have declined substantially in the world's oceans over the past century, researchers report in Nature1 this week. The findings add to concerns that climate change is dangerously altering marine ecosystems.

Phytoplankton are the basis of the entire marine food chain, and have an important role in the global carbon cycle. Through photosynthesis, they produce around half of the oxygen in Earth's atmosphere and drive the 'biological pump' that fixes 100 million tonnes of atmospheric carbon dioxide a day into organic material, which then sinks to the ocean floor when the phytoplankton die, or are grazed and digested.
 
Scientists: Bacteria spreading in warming oceans

Scientists: Bacteria spreading in warming oceans

That was the alarm sounded in a paper released online Tuesday on the eve of a two-day conference in Brussels.

The 200-page paper is a synthesis of the findings of more than 100 projects funded by the European Union since 1998. It was produced by Project CLAMER, a collaboration of 17 European marine institutes.

The paper says the rising temperature of ocean water is causing a proliferation of the Vibrio genus of bacteria, which can cause food poisoning, serious gastroenteritis, septicemia and cholera.

"Millions of euros in health costs may result from human consumption of contaminated seafood, ingestion of waterborne pathogens, and, to a lesser degree, though direct occupational or recreational exposure to marine disease," says the paper. "Climatic conditions are playing an increasingly important role in the transmission of these diseases."
 
PLoS ONE: Impact of Ocean Warming and Ocean Acidification on Larval Development and Calcification in the Sea Urchin Tripneustes gratilla

Impact of Ocean Warming and Ocean Acidification on Larval Development and Calcification in the Sea Urchin Tripneustes gratilla

As the oceans simultaneously warm, acidify and increase in PCO2, prospects for marine biota are of concern. Calcifying species may find it difficult to produce their skeleton because ocean acidification decreases calcium carbonate saturation and accompanying hypercapnia suppresses metabolism. However, this may be buffered by enhanced growth and metabolism due to warming.

We examined the interactive effects of near-future ocean warming and increased acidification/PCO2 on larval development in the tropical sea urchin Tripneustes gratilla. Larvae were reared in multifactorial experiments in flow-through conditions in all combinations of three temperature and three pH/PCO2 treatments. Experiments were placed in the setting of projected near future conditions for SE Australia, a global change hot spot. Increased acidity/PCO2 and decreased carbonate mineral saturation significantly reduced larval growth resulting in decreased skeletal length. Increased temperature (+3°C) stimulated growth, producing significantly bigger larvae across all pH/PCO2 treatments up to a thermal threshold (+6°C). Increased acidity (-0.3-0.5 pH units) and hypercapnia significantly reduced larval calcification. A +3°C warming diminished the negative effects of acidification and hypercapnia on larval growth.

This study of the effects of ocean warming and CO2 driven acidification on development and calcification of marine invertebrate larvae reared in experimental conditions from the outset of development (fertilization) shows the positive and negative effects of these stressors. In simultaneous exposure to stressors the dwarfing effects of acidification were dominant. Reduction in size of sea urchin larvae in a high PCO2 ocean would likely impair their performance with negative consequent effects for benthic adult populations.


Background
As the oceans simultaneously warm, acidify and increase in PCO2, prospects for marine biota are of concern. Calcifying species may find it difficult to produce their skeleton because ocean acidification decreases calcium carbonate saturation and accompanying hypercapnia suppresses metabolism. However, this may be buffered by enhanced growth and metabolism due to warming.

Methodology/Principal Findings
We examined the interactive effects of near-future ocean warming and increased acidification/PCO2 on larval development in the tropical sea urchin Tripneustes gratilla. Larvae were reared in multifactorial experiments in flow-through conditions in all combinations of three temperature and three pH/PCO2 treatments. Experiments were placed in the setting of projected near future conditions for SE Australia, a global change hot spot. Increased acidity/PCO2 and decreased carbonate mineral saturation significantly reduced larval growth resulting in decreased skeletal length. Increased temperature (+3°C) stimulated growth, producing significantly bigger larvae across all pH/PCO2 treatments up to a thermal threshold (+6°C). Increased acidity (-0.3-0.5 pH units) and hypercapnia significantly reduced larval calcification. A +3°C warming diminished the negative effects of acidification and hypercapnia on larval growth.

Conclusions and Significance
This study of the effects of ocean warming and CO2 driven acidification on development and calcification of marine invertebrate larvae reared in experimental conditions from the outset of development (fertilization) shows the positive and negative effects of these stressors. In simultaneous exposure to stressors the dwarfing effects of acidification were dominant. Reduction in size of sea urchin larvae in a high PCO2 ocean would likely impair their performance with negative consequent effects for benthic adult populations.
 
Dishonest CON$ always use the data from the defective ARGO floats, long after the defective floats were discovered and the problem corrected, that misread the depth and were recording temperatures at depths much deeper than their sensors recorded giving cooler temperatures.

Here is a chart from the journal Nature of the real ARGO data from floats reading the correct depth.

CGD 2010 Profiles in Science: Dr. Kevin Trenberth

Trenberth, K.E. and J.T. Fasullo. 2010: Global Change: The ocean is warming, isn't it? Nature, 465, 304-304, doi:10.1038/465304a.
trenberth2t.jpg


Figure 2: High resolution figure
A reappraisal of the messy data on upper-ocean heat content for 1993–2008 provides clear evidence for warming. But differences among various analyses and inconsistencies with other indicators merit attention.
Global atmospheric temperatures at Earth's surface are often taken as an indicator of global warming. Yet the atmosphere is battered by all sorts of natural variability associated with weather phenomena. More robust indicators of a warming planet come from evidence of increasing ocean heat content and associated sea-level rise. Yet observing systems that capitalize on these insights are in their infancy. On page 334 of this issue, a step forward is reported by Lyman et al.1 — they find a robust warming of the global upper ocean to be present in the data, in spite of considerable uncertainties arising from the observations themselves.


Figure caption: Changing heat content of the global ocean, with respect to the mean of 1993 to 2008.

465304a-f1.2.jpg


Here's what NOAA has to say about your little graphs.


http://www.cpc.ncep.noaa.gov/products/analysis_monitoring/enso_update/gsstanim.gif
And here's another graph that shows ocean sea level leveling off in contradiction of your predicitons.
If you think that graph shows 20 years of "no warming" as the title of this thread claims, then you are even more stupid than you pretend to be!!!!
 
And here's another graph that shows ocean sea level leveling off in contradiction of your predicitons.
If you think that graph shows 20 years of "no warming" as the title of this thread claims, then you are even more stupid than you pretend to be!!!!


Not at all. I am saying that ALL sources of info need to be looked at. Not just the ones that agree with your preconcieved idea.
 
So, some sources say there is no evidence of warming or cooling, some sources say there is evidence of warming, and some say there is evidence of cooling.

But, "the science is settled" and there is a "consensus" that it is warming.
 
And here's another graph that shows ocean sea level leveling off in contradiction of your predicitons.
If you think that graph shows 20 years of "no warming" as the title of this thread claims, then you are even more stupid than you pretend to be!!!!
Not at all. I am saying that ALL sources of info need to be looked at. Not just the ones that agree with your preconcieved idea.
That is hardly what the title of this thread that YOU started says at all!!! :eusa_liar:
And you know it! :eusa_liar:

What you are really saying is bullshit sources of info need to be looked into and be given equal validity when they support YOUR preconceived programming.
 
So, some sources say there is no evidence of warming or cooling, some sources say there is evidence of warming, and some say there is evidence of cooling.

But, "the science is settled" and there is a "consensus" that it is warming.
Among credible sources, the science IS settled. It is only the fringe whackos who say we are cooling. Why should unfounded and unsupportable bullshit be given equal standing with scientific data, like satellite data for an example???
 
So, some sources say there is no evidence of warming or cooling, some sources say there is evidence of warming, and some say there is evidence of cooling.

But, "the science is settled" and there is a "consensus" that it is warming.
Among credible sources, the science IS settled.

....
If the science is 'settled', then the science ends.

As there are several peer-reviewed authors cited in this thread alone, indicating that the data does not indicate warming, you are cherry picking the peer-reviewed science you give credibility.

.... It is only the fringe whackos who say we are cooling.

....
And, are those who say what I said - that there is evidence that there is cooling, there is evidence that there is warming, and there is evidence that we are neither cooling nor warming - are whackos, too, apparently.

.... Why should unfounded and unsupportable bullshit be given equal standing with scientific data, like satellite data for an example???
Only peer-reviewed work that confirms your belief is not bullshit, apparently.
 
Only peer-reviewed work that confirms your belief is not bullshit, apparently.

They call it the "TruthDoesn'tMatter Principle"... Appropriately named, don't you think?
I'd say so. Several peer-reviewed pieces are in this thread alone and they don't indicate any warming, several indicate there is warming, and some indicate there is cooling.

I guess the science isn't all that settled.

:eusa_whistle:
 
So, some sources say there is no evidence of warming or cooling, some sources say there is evidence of warming, and some say there is evidence of cooling.

But, "the science is settled" and there is a "consensus" that it is warming.
Among credible sources, the science IS settled.

....
If the science is 'settled', then the science ends.

As there are several peer-reviewed authors cited in this thread alone, indicating that the data does not indicate warming, you are cherry picking the peer-reviewed science you give credibility.

.... It is only the fringe whackos who say we are cooling.

....
And, are those who say what I said - that there is evidence that there is cooling, there is evidence that there is warming, and there is evidence that we are neither cooling nor warming - are whackos, too, apparently.

.... Why should unfounded and unsupportable bullshit be given equal standing with scientific data, like satellite data for an example???
Only peer-reviewed work that confirms your belief is not bullshit, apparently.
The only peer reviewed work that shows cooling comes from either satellite data that used the wrong sign to correct for diurnal satellite drift, or from ARGO floats that had faulty depth sensors. Once those errors were discovered and corrected no real scientist would continue to use the faulty data to claim cooling, BUT THE DENIERS STILL USE ONLY THE FAULTY DATA.

Why should peer reviewed work that was produced before the errors were discovered be given equal credibility with the data that came after the errors were corrected simply because the erroneous data was "peer reviewed" and agrees with your political bent?
 
Last edited:
Among credible sources, the science IS settled.

....
If the science is 'settled', then the science ends.

As there are several peer-reviewed authors cited in this thread alone, indicating that the data does not indicate warming, you are cherry picking the peer-reviewed science you give credibility.

And, are those who say what I said - that there is evidence that there is cooling, there is evidence that there is warming, and there is evidence that we are neither cooling nor warming - are whackos, too, apparently.

.... Why should unfounded and unsupportable bullshit be given equal standing with scientific data, like satellite data for an example???
Only peer-reviewed work that confirms your belief is not bullshit, apparently.
The only peer reviewed work that shows cooling comes from either satellite data that used the wrong sign to correct for diurnal satellite drift, and from ARGO floats that had faulty depth sensors. Once those errors were discovered and corrected no real scientist would continue to use the faulty data to claim cooling, BUT THE DENIERS STILL USE ONLY THE FAULTY DATA.

Why should peer reviewed work that was produced before the errors were discovered be given equal credibility with the data that came after the errors were corrected simply because the erroneous data was "peer reviewed" and agrees with your political bent?
You are only limiting yourself to SST, yet there are plenty of other measures of historical temps.

And, the paper I provided indicated no such thing. They found no cooling of SST; they found no warming, either, of SST.

But, the science is settled. So, as it's settled, you want it to stop, because that is what happens when there is no longer any valid scientific question.
 
Only peer-reviewed work that confirms your belief is not bullshit, apparently.

They call it the "TruthDoesn'tMatter Principle"... Appropriately named, don't you think?
I'd say so. Several peer-reviewed pieces are in this thread alone and they don't indicate any warming, several indicate there is warming, and some indicate there is cooling.

I guess the science isn't all that settled.

:eusa_whistle:

It's easy to settle the matter when you ignore all contrary data...

Thankfully, intelligent people look at ALL data....
 
And that same data shows that the global temps have stalled since at least 1998 within the statistical ability to detect a change.
LOLOLOLOL......you are such a clueless fruitcake, walleyed.

Global warming since 1995 'now significant'
By Richard Black -
BBC News
10 June 2011
(excerpts)

Climate warming since 1995 is now statistically significant, according to Phil Jones, the UK scientist targeted in the "ClimateGate" affair. By widespread convention, scientists use a minimum threshold of 95% to assess whether a trend is likely to be down to an underlying cause, rather than emerging by chance. If a trend meets the 95% threshold, it basically means that the odds of it being down to chance are less than one in 20. Last year's analysis, which went to 2009, did not reach this threshold; but adding data for 2010 takes it over the line.

"The trend over the period 1995-2009 was significant at the 90% level, but wasn't significant at the standard 95% level that people use," Professor Jones told BBC News. "Basically what's changed is one more year [of data]. That period 1995-2009 was just 15 years - and because of the uncertainty in estimating trends over short periods, an extra year has made that trend significant at the 95% level which is the traditional threshold that statisticians have used for many years. "It just shows the difficulty of achieving significance with a short time series, and that's why longer series - 20 or 30 years - would be a much better way of estimating trends and getting significance on a consistent basis."

Professor Jones' previous comment, from a BBC interview in Febuary 2010, is routinely quoted - erroneously - as demonstration that the Earth's surface temperature is not rising.


Denier cult myth - "It hasn't warmed since 1998"

Denier myth debunked - What has global warming done since 1998?


***
Ummmm, sure it did. Here is a graph from the AGW cultists you quote with diarhetic regularity...Note how there is all this heat in the oceans (that Trenberth can't seem to find, it's hiding down there somewhere in violation of all physical laws we know of, but it's down there) and the other graph is from ARGO. You'll notice the actual empirical data shows a slight decline in the oceans temp. Not some fanciful "I can't find the missing energy in the oceans because my damned dog at it" bullshit.

Oh, Walleyed, you swallow the lies and propaganda that your puppet masters spoon into your head and ignore the testimony of the actual scientists. You are such a retard!!!

New Evidence on Warming Ocean
NOAA

Wednesday, July 28, 2010
(Government publication - free to reproduce)

OceanHeatContent2_2009_720p.png


Recent studies show the world’s ocean is heating up as it absorbs most of the extra heat being added to the climate system from the build-up of heat-trapping gases in the atmosphere. In fact, more than 90 percent of Earth’s warming during the past 50 years has gone into the ocean. Warming has been observed even in the bottom-most reaches of the ocean, but most of the heat is accumulating in the ocean’s near-surface layers.

The implications of a warmer ocean are considerable. First, because water expands as it warms, ocean heating is responsible for much of the sea-level rise we’ve observed. Further, the ocean will hold the vast amount of heat it has accumulated because it warms and cools much more slowly than air. This makes sense if you’ve ever noticed how much quicker it is to heat the air in a room than the water in a swimming pool — and how much longer the pool holds its heat.

The colors on the map (top) show where and how much the heat content within the upper 2,460 feet (750 m) of the ocean had changed in 2009, compared to the average from 1993 to 2009. NOAA and NASA scientists produced the map using a combination of data from satellite altimeters and within-ocean thermometer readings collected by Argo floats and shipboard measurements. Scientists use these measurements to better understand the ocean’s roles in Earth’s climate system, and to help them more accurately predict future weather and climate patterns. Red and blue areas show where the upper ocean’s warmth rose or fell from its average value by as much as 3 billion Joules per square meter compared to the average — that’s enough energy in one square meter alone to power a 100-watt light bulb continuously for nearly a year. White areas indicate little or no change; gray areas represent land.

The solid black trend line on the graph (bottom) shows the ocean’s yearly average heat content from 1955 through 2009, as compared to the long-term baseline (gray line at zero). The thin red line shows the running 3-month average over that same span. Though there are year-to-year ups and downs, notice there has been a significant overall increase in the ocean’s heat content over the last 55 years. That ocean heat content change equals the energy needed to power eleven 1200-watt hair dryers for all 6.9 billion people now on the planet continuously over those same 55 years. It is also about 2.5 billion times greater than the energy released by the bomb that was dropped on Hiroshima.

where-is-global-warming1.jpg


For more information, please see the NOAA 2009 Annual State of the Climate Report, published on July 28, 2010. A NOAA press release about the report is also available.

Top map courtesy of Gregory Johnson and John Lyman, NOAA / JIMAR, and Josh Willis, NASA. Trend graph courtesy of Sydney Levitus, NOAA. Dot chart courtesy of Sara Veasey, NOAA.
 
If the science is 'settled', then the science ends.

As there are several peer-reviewed authors cited in this thread alone, indicating that the data does not indicate warming, you are cherry picking the peer-reviewed science you give credibility.

And, are those who say what I said - that there is evidence that there is cooling, there is evidence that there is warming, and there is evidence that we are neither cooling nor warming - are whackos, too, apparently.

Only peer-reviewed work that confirms your belief is not bullshit, apparently.
The only peer reviewed work that shows cooling comes from either satellite data that used the wrong sign to correct for diurnal satellite drift, and from ARGO floats that had faulty depth sensors. Once those errors were discovered and corrected no real scientist would continue to use the faulty data to claim cooling, BUT THE DENIERS STILL USE ONLY THE FAULTY DATA.

Why should peer reviewed work that was produced before the errors were discovered be given equal credibility with the data that came after the errors were corrected simply because the erroneous data was "peer reviewed" and agrees with your political bent?
You are only limiting yourself to SST, yet there are plenty of other measures of historical temps.

And, the paper I provided indicated no such thing. They found no cooling of SST; they found no warming, either, of SST.

But, the science is settled. So, as it's settled, you want it to stop, because that is what happens when there is no longer any valid scientific question.
Do you mean the paper that basically was incomplete trend wise and global wise? Talk about "cherry-picking."

From your post:

There is much space and time variability of 20-yr running trend estimates, indicating that trends over a decade or two may not be representative of longer-term trends. Results are based on sorting individual observations in World Ocean Database 2001 into 1° × 1° and 2° × 2° bins. Only bins with at least five observations per decade for four of the five decades since 1950 are used. Much of the World Ocean cannot be examined from this perspective.
 
Last edited:
If you think that graph shows 20 years of "no warming" as the title of this thread claims, then you are even more stupid than you pretend to be!!!!
Not at all. I am saying that ALL sources of info need to be looked at. Not just the ones that agree with your preconcieved idea.
That is hardly what the title of this thread that YOU started says at all!!! :eusa_liar:
And you know it! :eusa_liar:

What you are really saying is bullshit sources of info need to be looked into and be given equal validity when they support YOUR preconceived programming.


I hardly consider NOAA to be a BS source. They have problems just like any other beaurocracy, but they have good scientists there as well. You think it's OK to falsify data to support a political goal, I don't. That's the difference between you and I. I believe in scientific ethics, you wipe your ass with them.
 
LOLOLOLOL......you are such a clueless fruitcake, walleyed.

Global warming since 1995 'now significant'
By Richard Black -
BBC News
10 June 2011
(excerpts)

Climate warming since 1995 is now statistically significant, according to Phil Jones, the UK scientist targeted in the "ClimateGate" affair. By widespread convention, scientists use a minimum threshold of 95% to assess whether a trend is likely to be down to an underlying cause, rather than emerging by chance. If a trend meets the 95% threshold, it basically means that the odds of it being down to chance are less than one in 20. Last year's analysis, which went to 2009, did not reach this threshold; but adding data for 2010 takes it over the line.

"The trend over the period 1995-2009 was significant at the 90% level, but wasn't significant at the standard 95% level that people use," Professor Jones told BBC News. "Basically what's changed is one more year [of data]. That period 1995-2009 was just 15 years - and because of the uncertainty in estimating trends over short periods, an extra year has made that trend significant at the 95% level which is the traditional threshold that statisticians have used for many years. "It just shows the difficulty of achieving significance with a short time series, and that's why longer series - 20 or 30 years - would be a much better way of estimating trends and getting significance on a consistent basis."

Professor Jones' previous comment, from a BBC interview in Febuary 2010, is routinely quoted - erroneously - as demonstration that the Earth's surface temperature is not rising.


Denier cult myth - "It hasn't warmed since 1998"

Denier myth debunked - What has global warming done since 1998?


***
Ummmm, sure it did. Here is a graph from the AGW cultists you quote with diarhetic regularity...Note how there is all this heat in the oceans (that Trenberth can't seem to find, it's hiding down there somewhere in violation of all physical laws we know of, but it's down there) and the other graph is from ARGO. You'll notice the actual empirical data shows a slight decline in the oceans temp. Not some fanciful "I can't find the missing energy in the oceans because my damned dog at it" bullshit.

Oh, Walleyed, you swallow the lies and propaganda that your puppet masters spoon into your head and ignore the testimony of the actual scientists. You are such a retard!!!

New Evidence on Warming Ocean
NOAA

Wednesday, July 28, 2010
(Government publication - free to reproduce)

OceanHeatContent2_2009_720p.png


Recent studies show the world’s ocean is heating up as it absorbs most of the extra heat being added to the climate system from the build-up of heat-trapping gases in the atmosphere. In fact, more than 90 percent of Earth’s warming during the past 50 years has gone into the ocean. Warming has been observed even in the bottom-most reaches of the ocean, but most of the heat is accumulating in the ocean’s near-surface layers.

The implications of a warmer ocean are considerable. First, because water expands as it warms, ocean heating is responsible for much of the sea-level rise we’ve observed. Further, the ocean will hold the vast amount of heat it has accumulated because it warms and cools much more slowly than air. This makes sense if you’ve ever noticed how much quicker it is to heat the air in a room than the water in a swimming pool — and how much longer the pool holds its heat.

The colors on the map (top) show where and how much the heat content within the upper 2,460 feet (750 m) of the ocean had changed in 2009, compared to the average from 1993 to 2009. NOAA and NASA scientists produced the map using a combination of data from satellite altimeters and within-ocean thermometer readings collected by Argo floats and shipboard measurements. Scientists use these measurements to better understand the ocean’s roles in Earth’s climate system, and to help them more accurately predict future weather and climate patterns. Red and blue areas show where the upper ocean’s warmth rose or fell from its average value by as much as 3 billion Joules per square meter compared to the average — that’s enough energy in one square meter alone to power a 100-watt light bulb continuously for nearly a year. White areas indicate little or no change; gray areas represent land.

The solid black trend line on the graph (bottom) shows the ocean’s yearly average heat content from 1955 through 2009, as compared to the long-term baseline (gray line at zero). The thin red line shows the running 3-month average over that same span. Though there are year-to-year ups and downs, notice there has been a significant overall increase in the ocean’s heat content over the last 55 years. That ocean heat content change equals the energy needed to power eleven 1200-watt hair dryers for all 6.9 billion people now on the planet continuously over those same 55 years. It is also about 2.5 billion times greater than the energy released by the bomb that was dropped on Hiroshima.

where-is-global-warming1.jpg


For more information, please see the NOAA 2009 Annual State of the Climate Report, published on July 28, 2010. A NOAA press release about the report is also available.

Top map courtesy of Gregory Johnson and John Lyman, NOAA / JIMAR, and Josh Willis, NASA. Trend graph courtesy of Sydney Levitus, NOAA. Dot chart courtesy of Sara Veasey, NOAA.


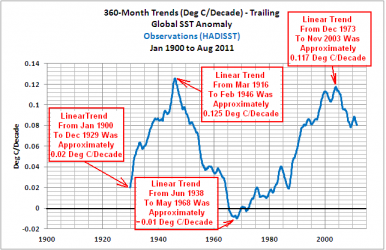
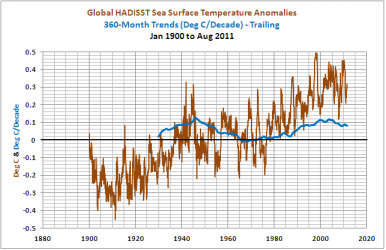
Let us look at another source shall we? Please note how the science isn't settled no matter how loudly you scream.

"WHY 17-YEAR AND 30-YEAR TRENDS?

A recent paper by Santer et al (2011) Separating Signal and Noise in Atmospheric Temperature Change: The Importance of Timescale, state at the conclusion of their abstract that, “Our results show that temperature records of at least 17 years in length are required for identifying human effects on global-mean tropospheric temperature.” Sea surface temperature data is not as noisy as Lower Troposphere temperature anomalies, so we’ll assume that 17 years would be appropriate timescale to present sea surface temperature trends on global and hemispheric bases as well. And 30 years: Wikipedia defines Climate “as the weather averaged over a long period. The standard averaging period is 30 years, but other periods may be used depending on the purpose.”

But we’re using monthly data so the trends are actually for 204- and 360-month periods.


"COMPARISONS OF SEA SURFACE TEMPERATURE ANOMALY TRENDS OF CLIMATE MODEL OUTPUTS AND INSTRUMENT-BASED OBSERVATIONS

In each of the following graphs, I’ve included the following notes. The first one reads,

The Models Do Not Produce Multidecadal Variations In Sea Surface Temperature Anomalies Comparable To Those Observed, Because They Are Not Initialized To Do So. This, As It Should Be, Is Also Evident In Trends.

And since those notes in red are the same for Figure 4 through 9, you’ll probably elect to overlook them. The other note on each of the graphs describes the difference between the observed trends for the most recent period and the trends hindcast and projected by the models. And they are significant, so don’t overlook those notes.

There’s no reason for me to repeat what’s discussed in the notes on the graphs, so I’ll present the comparisons of the 360-month and 204-month trends first for Global Sea Surface Temperature anomalies, then for the Northern Hemisphere data, and finally for the Southern Hemisphere Sea Surface Temperature anomaly data. Some of you may find the results surprising."


Climate Explorer: Select a monthly field

17-Year And 30-Year Trends In Sea Surface Temperature Anomalies: The Differences Between Observed And IPCC AR4 Climate Models | Bob Tisdale – Climate Observations
 

Attachments

  • $zxjs3k.png
    $zxjs3k.png
    14 KB · Views: 80
  • $116uz50.png
    $116uz50.png
    12.7 KB · Views: 77

Forum List

Back
Top