Ocean Temps, Models vs Reality

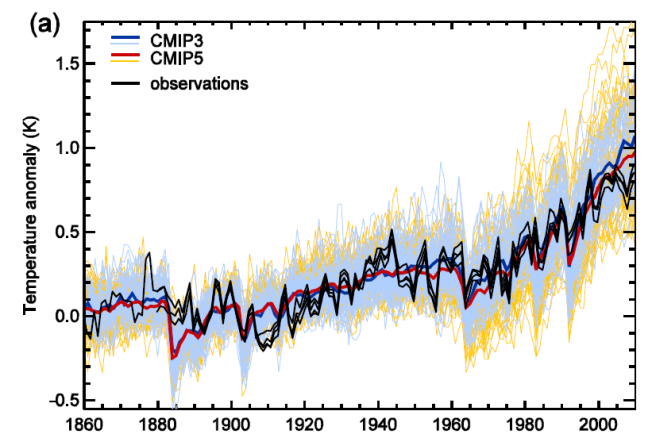
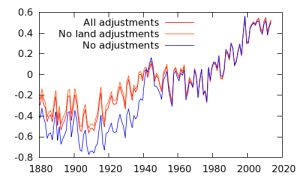
Similar type of graph from AR3-

foiextract20131121-28074-u20zz2-0-106_1.png

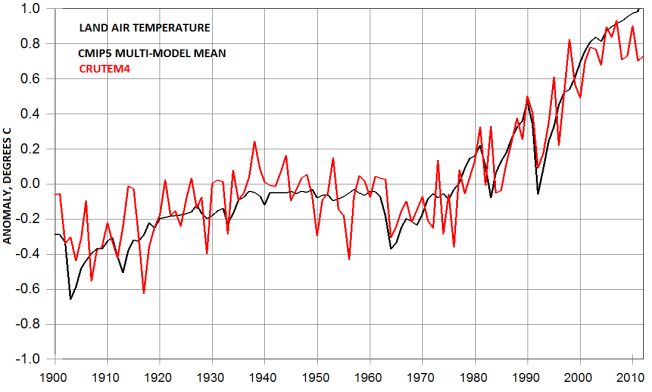
Interesting Step Increase in 1940... The difference between using real buckets, bags, and water intakes corrected to read like buckets...? Almost a full degree C rise... How do you overcome the disparity and not loose credibility?


Yup. And the bucket adjustment is only one type of correction. Every type of correction adds its own error bar.

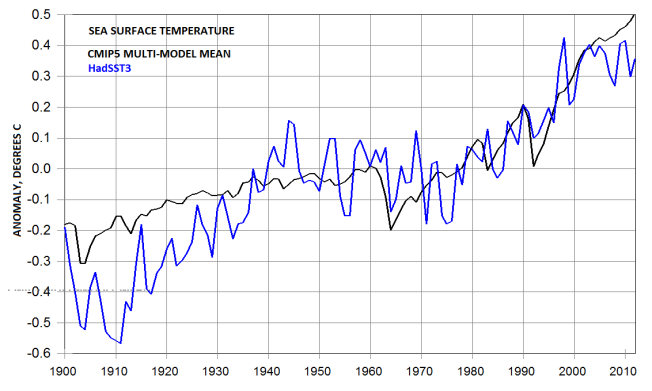
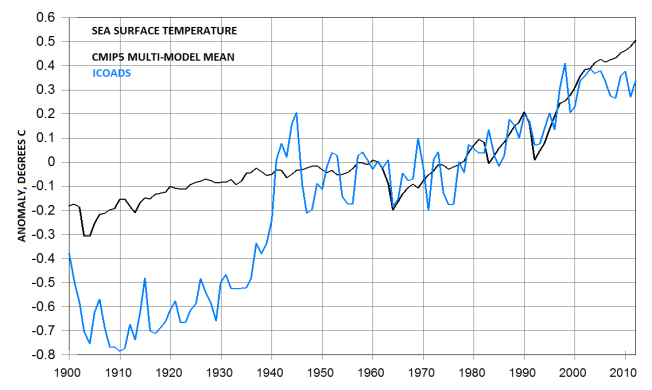
In the end you get a thin line on a graph and everyone ignores the error range anyways. And if the climate model predictions need a little change here or there then a little fine tuning is done and we have a different thin line on a graph.
 
AR5-

image1.png


Broken down into land and ocean data-

image2.png


fig3.png


And with SST raw data-

fig4.png


I believe that gives you an idea why the SSTs were adjusted up.

upload_2016-2-5_17-59-14.png


Every single one of those unadjusted graphs show a zero trend for almost 20 years. I believe that would be problematic for the alarmist cult.. and no major rise to give the hottest anything... oop'sie...
 
Another fine "Those scientists don't know 'nuffin!" thread.

One wonders why, given their self-proclaimed expertise, certain people only post on message boards. As they claim to understand the science far better than the scientists, shouldn't they be submitting their groundbreaking work to various journals?

Oh wait. They're just mindlessly pasting various cherrypicked graphs that don't actually support anything they're saying. Never mind.
 
WOW!!! mamooth didnt call me a conspiracy theorist, for a change.

for the last year or so mamooth has been pushing the idea that because there is MORE warming in the totally uncorrected global temperature records than there is in the corrected global dataset, then it is impossible for any temperature corrections to be arbitrary or enacted for the purpose of making global warming predictions more feasible. usually he puts up a graph something like this

global-t-fig-1.png


I have repeatedly asked him if he understands that ocean adjustments, and the bucket adjustment in particular, make up almost all of the pre 1940 upwards movement of the graph line, which indeed does lower the trend. mamooth has declined to debate the individual classes of adjustments and will only discuss the 'whole adjustment'. after pressing him for a time frame for when these adjustments were implimented he referenced Parker95, which I will accept. therefore the main adjustments were already in place since 1995.

What has happened since 1995? Unfortunately it was not understood until recently how earlier versions of global datasets would disappear as new ones appeared. publicly available maturity graphs (detailed records of changes made) only go back to 2008.

6a010536b58035970c01bb08b3625a970d-800wi

6a010536b58035970c01b7c80e94ef970b-800wi


hahahaha. up until jun2015 the spread was much larger. I wonder if the jan1915 anomaly was singled out for special treatment?

6a010536b58035970c01bb08b36274970d-800wi

6a010536b58035970c01b7c80e9471970b-800wi


it is obvious that tinkering with historical temperatures is an ongoing problem. and that the general movement is to cool the pre 1940 20th century data and warm the post 1975 data.


I have already shown in previous posts here how the climate model hindcasts would look totally pathetic without the bucket adjustments. was that the reason for the adjustment? good grief, I certainly hope not! I am sure that it is a reasonable correction, albeit one with large error range that can be 'pushed' a considerable distance either way if the need arises.
 

Forum List

Back
Top