Misery index the highest in 28 years

The average Unemployment rate for Bush's 8 years was 5.2%.

Quoting the average unemployment rate during Bush's term is one way (of many) of trying to obscure that fact that the economy fell apart in the last two years of Bush's presidency -- even WITH those low tax rates. Imagine that.

Who took over complete control of Congress in 07'?

This is one of the tactics I've always found objectionable when partisans (from either party) try to use it as a pseudo get-out-of-jail-free-card to evade responsibility for active policies of their own party by somehow insinuating that a congressional majority by the "other" party means that no responsibility can be attributed to their own party which just so happens to run the executive branch AND, all the cabinet posts, the regulatory boards, and their policy apparatus.

Edit to add: Keep in mind that Bush 43 never vetoed one spending bill (or any bill of any kind) in his first six years in office.
 
Last edited:
Quoting the average unemployment rate during Bush's term is one way (of many) of trying to obscure that fact that the economy fell apart in the last two years of Bush's presidency -- even WITH those low tax rates. Imagine that.

Who took over complete control of Congress in 07'?

This is one of the tactics I've always found objectionable when partisans (from either party) try to use it as a pseudo get-out-of-jail-free-card to evade responsibility for active policies of their own party by somehow insinuating that a congressional majority by the "other" party means that no responsibility can be attributed to their own party which just so happens to run the executive branch AND, all the cabinet posts, the regulatory boards, and their policy apparatus.

Edit to add: Keep in mind that Bush 43 never vetoed one spending bill (or any bill of any kind) in his first six years in office.

I fault Bush for not using his veto during the six years he had a Republican majority to put a brake on spending, but his policies did keep people employed. You do understand that when the Democrats took control of the purse strings in 2007, things went to hell in a hand basket don't you?

Object all you want too, but that is not a tactic, it is a fact!
 
As far as employment, those of you who consider something that pays $10 per hour a "job" are dimwits. Sorry but $10 per hour isnt going to keep a family going. SO when BOTH SIDES call a 40 hour a week "job" that pays $10 per hour I just laugh. I dont care if its only picking up cigarette butts. $10 per hour is for kids ONLY, no adults. IN FACT THERE SHOULD BE A LAW AGAINST ANYONE OVER 18 ACCEPTING SUCH A SLAVE PITTANCE. A job is one that pays well, not this Mcdonalds garbage. I hear rush talking about how valuable those jobs are. And he expected someone with half a brain to believe that terrible rubbish. Sicko.
 
Who took over complete control of Congress in 07'?

This is one of the tactics I've always found objectionable when partisans (from either party) try to use it as a pseudo get-out-of-jail-free-card to evade responsibility for active policies of their own party by somehow insinuating that a congressional majority by the "other" party means that no responsibility can be attributed to their own party which just so happens to run the executive branch AND, all the cabinet posts, the regulatory boards, and their policy apparatus.

Edit to add: Keep in mind that Bush 43 never vetoed one spending bill (or any bill of any kind) in his first six years in office.

I fault Bush for not using his veto during the six years he had a Republican majority to put a brake on spending, but his policies did keep people employed. You do understand that when the Democrats took control of the purse strings in 2007, things went to hell in a hand basket don't you?

Object all you want too, but that is not a tactic, it is a fact!

It's a fact like the following statement is a fact:

America was not attacked by terrorists on our home soil until Bush 43 became president.

Even IF I could convincingly make a case that Bush wasn't paying much attention to the Aug 6 PDB that Condi Rice presented to Bush while he was on vacation in Texas, I certainly couldn't expect anyone to accept the premise that Bush was the cause of the attack.

In other words, you are using a false premise that there is somehow a cause and effect between Congress being taken over by Democrats in 2006 and the economy tanking in 2007. If you want to do that, present some evidence where the Democratic Congress overturned a presidential veto and forced a spending bill or some kind of other major legislation on the country against the expressed wishes of our then Decider-in-Chief.
 
CBO outlook on long-term debt worsens

Until the Elitists in the District Of Criminals cease with their petty politics, PLAYING literally with the lives of others? It's about to get worse...the proverbial SHIT is about to hit the fan...

*Mark My Words*

Prepare yourselves...
Now suddenly the CBO is credible! On another thread when the CBO said the stimulus created millions of jobs, CON$ told us the CBO was worthless!
When Have I said they weren't? PICK yer battles dumbfuck...you might glean some credability.
 
Quoting the average unemployment rate during Bush's term is one way (of many) of trying to obscure that fact that the economy fell apart in the last two years of Bush's presidency -- even WITH those low tax rates. Imagine that.

Who took over complete control of Congress in 07'?

This is one of the tactics I've always found objectionable when partisans (from either party) try to use it as a pseudo get-out-of-jail-free-card to evade responsibility for active policies of their own party by somehow insinuating that a congressional majority by the "other" party means that no responsibility can be attributed to their own party which just so happens to run the executive branch AND, all the cabinet posts, the regulatory boards, and their policy apparatus.

Edit to add: Keep in mind that Bush 43 never vetoed one spending bill (or any bill of any kind) in his first six years in office.

And Bush never wrote one single bill that he signed.

Are you claiming he's a genius or an idiot. Make up your fucken mind on that one because I'm tired of the excuses.

If Bush got nothing but shit bills from Congress the last 2 years of his administration then what he got was nothing to help improve a sinking economy.

There is only so much a President can do by executive order whilst being badgered by a hostile Congress and a hostile press about every friggen problem in the Universe.
 
Last edited:
News Headlines
Is this still GWB fault?

You must think Obama is all powerful to create such a mess in 2 years. Yes he did his part by continuing failed methods.
Bush did his part to create this mess, so did Reagan, Clinton and both houses of congress.

But to blame it all on Obama is blindly partisan to the point of ultimate stupidity.


Of course this insatiable appetite of the Federal government to EXPAND and spend--spend-spend-control--control--control has been going on for decades--and it is what has gotten us into this mess.

But OBAMA bought and paid for this one with the borrowed and spent 787 billion dollar economic stimulus bill 2-1/2 years ago with the PROMISE that it would create MILLIONS of new jobs. That then went from creating jobs--to "saving" government workers jobs--to Nancy Pelosi referring to unemployment checks as economic "stimulus." IOW--Obama has made it much worse.

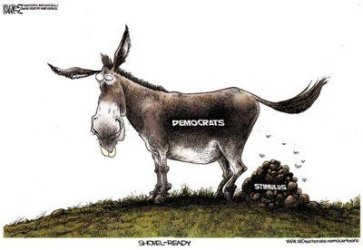
$donkey stimulus.jpg
 
News Headlines
Is this still GWB fault?

I bet progressives have absolutely no idea how the misery index is calculated....

I thought the stimulus' were supposed to save us all???

I suppose not...

That piece of shit Obama only "saved" his union voting base, UAW and public sector unions while he actually had the fucking audacity to stick the private sector with the bill...

The private sector may as well have PAID TO LOSE THEIR JOBS... They're going to get taxed for it, their unborn kids will be taxed for it...

Its the progressives mission to destroy capitalism anyways.
 
Do not forget Obama has kept 1/2 of tarp also. The original intent was to keep credit flowing and stop the run on the banks to big to fail as well as AIG
that come and except AIG went
Now Fanni and Freddi are getting some of it to keep them afloat also
but out of the 750 billion, very little GWB used
Obama has the other 350 billion and who knows what he has(is) doing with it except the UAW bailout

In cash Obama has grabbed 900 billion dollars of tax payers wealth with tarp and the failed stimulus
 
A number not seen since 1983, a year before Ronald Reagan was re-elected.

Yes, when Jimma Cawta was President.

The water is 80 degrees, the margaritas are crisp. What misery? LMAO! I was thinking that if we didn't have partys, who would we blame. Here is the president misery index. :eek: LMAO!!

Natl_Debt_Chart_2006-738252_ef128.gif


Its 2011 by my calendar s0n!!!:up:


This is a POLITICS forum, not a history forum. The perception is..........things are shitty and getting shittier. You can post up 1,000 nutty-ass charts and graphs............wont change the level of shittiness a speck.:fu:


ANyway.........only a k00k would post up a historical look at the debt these days. I cant even think of a hysterical enough analogy that would fit.
 
Last edited:
Yes there are at least two things that changed as far as I know

1. Fuel and food are NOT included in CPI

2. Subsitution of purchases is now part of the equasion. (they keep changing the theoretical basket of goods, that way, you see?)

Both of these changes tend to statistically significantly understate the REAL rate of inflation that hits the average person.

And by understating the real rate of inflation on real live consumers, social security and other contracts that are have COLAs lose ground in terms of purhasing power Vs inflation.

The simplistic MISERY Index ought to include things like number of prisoners, bankruptsies, and changes in the percentage of people who go on disability.

They might also include suicides per thousand, and crime rates.

And they would, too if anybody in charge of this society actually gave a rat's ass, I think.

They should call Obama what he is. The President of hopelessness and the President of change for the worse.

Hope And Change gone wrong.

Food and fuel are most definitely included in CPI.

What goods and services does the CPI cover?

The CPI represents all goods and services purchased for consumption by the reference population (U or W) BLS has classified all expenditure items into more than 200 categories, arranged into eight major groups. Major groups and examples of categories in each are as follows:
FOOD AND BEVERAGES (breakfast cereal, milk, coffee, chicken, wine, full service meals, snacks)
HOUSING (rent of primary residence, owners' equivalent rent, fuel oil, bedroom furniture)
APPAREL (men's shirts and sweaters, women's dresses, jewelry)
TRANSPORTATION (new vehicles, airline fares, gasoline, motor vehicle insurance)
MEDICAL CARE (prescription drugs and medical supplies, physicians' services, eyeglasses and eye care, hospital services)
RECREATION (televisions, toys, pets and pet products, sports equipment, admissions);
EDUCATION AND COMMUNICATION (college tuition, postage, telephone services, computer software and accessories);
OTHER GOODS AND SERVICES (tobacco and smoking products, haircuts and other personal services, funeral expenses).

Consumer Price Index Frequently Asked Questions

Is it?

Well yes and no

Transmission of material in this release is embargoed until
8:30 a.m. (EDT) Wednesday, June 15, 2011 USDL-11-0890

Technical information: (202) 691-7000 [email protected] Consumer Price Index (CPI)
Media Contact: (202) 691-5902 [email protected]

Consumer Price Index - May 2011

The Consumer Price Index for All Urban Consumers (CPI-U) increased
0.2 percent in May on a seasonally adjusted basis, the U.S. Bureau of
Labor Statistics reported today. Over the last 12 months, the all
items index increased 3.6 percent before seasonal adjustment.

The index for all items less food and energy increased 0.3 percent in
May, its largest increase since July 2008. The indexes for apparel,
shelter, new vehicles, and recreation all contributed to the
acceleration, rising more in May than in April. These increases more
than offset declines in the indexes for airline fare, tobacco, and
personal care.

The food index rose in May as well. The food at home index repeated
its April increase of 0.5 percent as four of the six major grocery
store food group indexes increased, with the index for meats,
poultry, fish, and eggs rising the most. In contrast, the energy
index, which had been rising sharply, declined in May. The gasoline
index decreased for the first time since last June, although the
index for household energy increased.

The upward trend among the 12 month increases of major indexes
continued in May. The 12 month change in the all items index, which
was 1.1 percent as recently as November, reached 3.6 percent in May.
The energy index has increased 21.5 percent over the last 12 months,
the food index has risen 3.5 percent and the index for all items less
food and energy has increased 1.5 percent. All of these figures have
been rising in recent months.


Table A. Percent changes in CPI for All Urban Consumers (CPI-U): U.S. city
average


Seasonally adjusted changes from
preceding month
Un-
adjusted
Nov. Dec. Jan. Feb. Mar. Apr. May 12-mos.
2010 2010 2011 2011 2011 2011 2011 ended
May 2011

All items.................. .1 .4 .4 .5 .5 .4 .2 3.6
Food...................... .2 .1 .5 .6 .8 .4 .4 3.5
Food at home............. .2 .2 .7 .8 1.1 .5 .5 4.4
Food away from home (1).. .1 .1 .2 .2 .3 .3 .2 2.2
Energy.................... .1 4.0 2.1 3.4 3.5 2.2 -1.0 21.5
Energy commodities....... .7 6.4 4.0 4.8 5.5 3.1 -1.9 36.2
Gasoline (all types).... .7 6.7 3.5 4.7 5.6 3.3 -2.0 36.9
Fuel oil (1)............ 4.2 4.9 6.8 5.8 6.2 3.2 -.8 36.0
Energy services.......... -.8 .6 -.6 1.1 .2 .6 .6 1.1
Electricity............. .6 .3 -.5 .4 .7 .2 .8 1.8
Utility (piped) gas
service.............. -5.3 1.7 -1.2 3.4 -1.4 1.9 -.3 -1.2
All items less food and
energy................. .1 .1 .2 .2 .1 .2 .3 1.5
Commodities less food and
energy commodities.... .0 -.1 .2 .2 .1 .4 .5 1.2
New vehicles............ -.2 -.1 -.1 1.0 .7 .7 1.1 3.4
Used cars and trucks.... .1 -.1 -.3 .1 .8 1.2 1.1 4.1
Apparel................. .1 .1 1.0 -.9 -.5 .2 1.2 1.0
Medical care commodities
(1).................. .2 .1 .5 .7 .5 .5 .0 3.0
Services less energy
services.............. .2 .1 .1 .2 .2 .1 .2 1.6
Shelter................. .1 .1 .1 .1 .1 .1 .2 1.1
Transportation services .4 .2 .6 .5 .5 .2 .1 3.3
Medical care services... .2 .3 -.1 .4 .1 .3 .3 3.0

1 Not seasonally adjusted.


Consumer Price Index Data for May 2011

Food

The food index rose 0.4 percent in May, the same increase as in
April. The food at home index increased 0.5 percent and has risen 3.7
percent since December. Among major grocery store food groups, the
index for meats, poultry, fish, and eggs rose 1.5 percent and the
cereals and bakery products index increased 1.0 percent. The dairy
and related products index and the index for other food at home
posted smaller increases, while the index for nonalcoholic beverages
was unchanged. The only group to decline was the fruits and
vegetables index, which declined 1.3 percent as a sharp decline in
the index for tomatoes caused the fresh vegetables index to fall for
the second straight month after sharp increases early in the year.
The food at home index has risen 4.4 percent over the last 12 months
with all major grocery store food groups posting increases. The index
for food away from home rose 0.2 percent in May after rising 0.3
percent in each of the previous two months.


Energy

The energy index declined 1.0 percent in May ending a series of ten
consecutive advances. After a series of several sharp increases, the
gasoline index declined 2.0 percent in May. (Before seasonal
adjustment, gasoline prices rose 3.6 percent in May.) Despite the May
decline, the gasoline index has increased 23.7 percent over the past
six months. The index for household energy increased in May, rising
0.5 percent after a 0.7 percent increase in April. The index for
electricity rose 0.8 percent, more than offsetting a 0.8 percent
decline in the fuel oil index and a 0.3 percent decrease in the index
for natural gas. The household energy index has risen 2.9 percent
over the last 12 months, with the fuel oil index up 36.0 percent and
the electricity index up 1.8 percent but the index for natural gas
down 1.2 percent.


All items less food and energy

The index for all items less food and energy rose 0.3 percent in May
after increasing 0.1 percent in March and 0.2 percent in April. The
shelter index rose 0.2 percent in May after increasing 0.1 percent in
each of the seven previous months. Both rent and owners' equivalent
rent rose 0.1 percent; the acceleration in shelter was due to the
index for lodging away from home, which rose 2.9 percent in May after
being unchanged in April. The apparel index increased in May, rising
1.2 percent after a 0.2 percent increase in April. The index for new
vehicles rose 1.1 percent in May after increasing 0.7 percent in
April; the index for used cars and trucks also rose 1.1 percent. The
index for recreation, which was unchanged in April, rose 0.3 percent
in May. The medical care index rose 0.2 percent, with the index for
medical care commodities unchanged and the index for medical care
services up 0.3 percent. The index for household furnishings and
operations advanced 0.2 percent, the same increase as in April. In
contrast to these increases, the index for airline fares fell 1.3
percent in May, and the indexes for tobacco and for personal care
both declined 0.2 percent.

The index for all items less food and energy increased 1.5 percent
over the last 12 months, with virtually all of its major component
indexes rising at a faster rate over the past six months than they
did from May to November of 2010.


Not seasonally adjusted CPI measures

The Consumer Price Index for All Urban Consumers (CPI-U) increased
3.6 percent over the last 12 months to an index level of 225.964
(1982-84=100). For the month, the index increased 0.5 percent prior
to seasonal adjustment.

The Consumer Price Index for Urban Wage Earners and Clerical Workers
(CPI-W) increased 4.1 percent over the last 12 months to an index
level of 222.954 (1982-84=100). For the month, the index rose 0.5
percent prior to seasonal adjustment.

The Chained Consumer Price Index for All Urban Consumers (C-CPI-U)
increased 3.3 percent over the last 12 months. For the month, the
index increased 0.4 percent on a not seasonally adjusted basis.
Please note that the indexes for the post-2009 period are subject to
revision.

The Consumer Price Index for June 2011 is scheduled to be released on
Friday, July 15, 2011, at 8:30 a.m. (EDT).

Source

The question is which CPI is the CPI that is used when COLAs are determined?

I'm informed that the CPI used here for Social Secuity is the first one mentioned here...the one that does not include FOOD AND FUEL.

If I have been misinformed (that often happens, ya know?) then by all means point me to someplace where I can get the correct infomation

Since 1975, Social Security's general benefit increases have been based on increases in the cost of living, as measured by the Consumer Price Index. We call such increases Cost-Of-Living Adjustments, or COLAs. Because there has been a decline in the Consumer Price Index, there will be no COLA payable in 2011.

Now...are you trying to tell us that there is NO PRICE RISES in food and Fuel during 2011?

Apparently the CPI that the federal government is using thinks there was no INFLATION in 201o.

Was that YOUR experience in 2010?

It might have been if you didn't purchase any FUEL OR FOOD, but otherwise?

Like I said, CPI includes food and fuel. If you want to talk about CORE CPI, you have to understand what the extra word means.

By law, Social Security and Supplemental Security Income benefits increase automatically if there is an increase in the Bureau of Labor Statistics' Consumer Price Index for Urban Wage Earners and Clerical Workers (CPI-W), from the third quarter of the year in which a COLA was last determined to the corresponding period of the current year. This year there was no increase in the CPI-W from the third quarter of 2008 to the third quarter of 2010.

The 2011 COLA

Let me know if you have any other questions.
 
Yes, when Jimma Cawta was President.

The water is 80 degrees, the margaritas are crisp. What misery? LMAO! I was thinking that if we didn't have partys, who would we blame. Here is the president misery index. :eek: LMAO!!

Natl_Debt_Chart_2006-738252_ef128.gif


Its 2011 by my calendar s0n!!!:up:


This is a POLITICS forum, not a history forum. The perception is..........things are shitty and getting shittier. You can post up 1,000 nutty-ass charts and graphs............wont change the level of shittiness a speck.:fu:


ANyway.........only a k00k would post up a historical look at the debt these days. I cant even think of a hysterical enough analogy that would fit.

In addition that graph means nothing
we created over 40 million jobs from 83-08
and the GOP presidents added about 6 trillion dollars of debt (with mostly a dem congress) during those 12 years they were in charge
with 9-11 and the 19% intrest rates in the early 80s, well you get the picture
Typical CON$ervative fuzzy math, 83-08 is 25 years not 12.

Now, over half of those 40 million jobs were created during Clinton's 8 years, and including interest $12 trillion of the current $14+ trillion in debt came from Reagan, Bush I and Bush II alone.
 
Last edited:
The question is which CPI is the CPI that is used when COLAs are determined?

I'm informed that the CPI used here for Social Secuity is the first one mentioned here...the one that does not include FOOD AND FUEL.

If I have been misinformed (that often happens, ya know?) then by all means point me to someplace where I can get the correct infomation
You have been misinformed. Common Misconceptions about the CPI
Has the BLS removed food or energy prices in its official measure of inflation?
No. The BLS publishes thousands of CPI indexes each month, including the headline All Items CPI for All Urban Consumers (CPI-U) and the CPI-U for All Items Less Food and Energy. The latter series, widely referred to as the "core" CPI, is closely watched by many economic analysts and policymakers under the belief that food and energy prices are volatile and are subject to price shocks that cannot be damped through monetary policy. However, all consumer goods and services, including food and energy, are represented in the headline CPI.

Most importantly, none of the prominent legislated uses of the CPI excludes food and energy. Social security and federal retirement benefits are updated each year for inflation by the All Items CPI for Urban Wage Earners and Clerical Workers (CPI-W). Individual income tax parameters and Treasury Inflation-Protected Securities (TIPS) returns are based on the All Items CPI-U.
emphasis mine.

Now...are you trying to tell us that there is NO PRICE RISES in food and Fuel during 2011?
Nobody is saying that.
Apparently the CPI that the federal government is using thinks there was no INFLATION in 201o.
Social Security and retirement benefit increases are based on the changes of the 3rd quarter average. So to determine the increase, we look at the Database and select US city average, all items, seasonally adjusted and see that for July-Sep 2009 the index average was 210.742, and July-Sep 2009 the average was 213.902, giving a change of 1.5%. The minimum change to trigger an increase is 3%. Specifically, Energy went up 4.4% but food only went up 1.1%. Weighting and averaging all items gives 1.5%.
 
Last edited:
The threads intent is to highlight just how far things have sunk sense Obama was elected. I only have ask that the left deliberate the issues with an honest debate

The best they can do is show a debt graph that if Obama was include would look much much much different

Is there one reason we should re-elect Obama?
 

Forum List

Back
Top