Navigation
Install the app
How to install the app on iOS
Follow along with the video below to see how to install our site as a web app on your home screen.

Note: This feature currently requires accessing the site using the built-in Safari browser.
More options
You are using an out of date browser. It may not display this or other websites correctly.
You should upgrade or use an alternative browser.
You should upgrade or use an alternative browser.
Lewandowsky and Cook's papers on Skeptics
- Thread starter IanC
- Start date
- Dec 18, 2013
- 136,659
- 27,997
- 2,180
Let's see your peer review that says the exact opposite.
How about once you show your proof and stop asking everyone else to show you theirs?
Let's see the proof that storms are more severe today. Give it to us, you are the one who brought it up, this is on you!
Last edited:

Let's see your peer review that says the exact opposite.
"Thunder-day occurrences during a 100-year period based on data from carefully screened records of 86 first-order stations distributed across the United States were assessed for temporal fluctuations and trends during 18961995. Short-term (<10-year) fluctuations of adjacent stations were often dissimilar reflecting localized differences in storm activity in a few years, making spatial interpretations difficult. But, temporal fluctuations based on 20-year and longer periods exhibited regional coherence reflecting the control of large, synoptic-scale weather systems on the distribution of thunderstorms over broad areas. Classification of station fluctuations based on 20-year periods revealed six types of distributions existed and they formed 12 discrete areas across the nation. One type present in the lower Midwest and the South had a peak in storm activity in 19161935 followed by a general decline to 19761995. A second type maximizing at the same time had its minimum earlier, in 19561975. Another distribution found at stations in the upper Midwest and Northeast had a mid-century peak (19361955) with a recent minimum in 19761995. A fourth distribution also peaked in 19361955 but had an early minimum in 18961915, and it mainly occurred in the northern plains and Rocky Mountains. A fifth distribution peaked during 19561975 and was found at stations in four areas including the central High Plains, Southwest, northern Great Lakes, and Southeast. The sixth temporal distribution showed a steady increase in storm activity during the 100-year period, peaking in 19761995, and covered a large area extending from the Pacific Northwest across the central Rockies and into the southern High Plains. The national average distribution based on all station values peaked in mid century. The national distribution differs markedly from several regional distributions illustrating the importance of using regional analysis to assess temporal fluctuations in severe weather conditions in the nation. The 100-year linear trends of the 86 stations defined six regions across the U.S. Significant upward trends existed over most of the western two-thirds of the nation, unchanging trends existed in the northern plains and Midwest, and downward trends were found in most of the nation's east. The up trends in storm-day frequencies in the southern plains occurred where storm damage is greatest and where demographic changes have added to storm losses over time. The national patterns of trends and storm distributions were similar to those found for hail. The temporal distributions of storm activity helped explain recent increases in major storms and their losses, conditions which have increased in the west and south."
ingentaconnect Long-Term Fluctuations in Thunderstorm Activity in the United Sta...
[1] We conducted 228-year long, three-member ensemble simulations using a high resolution (60 km grid size) global atmosphere model, MRI-AGCM3.2, with prescribed sea surface temperature and greenhouse gases and aerosols from 1872 to 2099. We found a clear decreasing trend of global tropical cyclone (TC) frequency throughout the 228 years of the simulation. We also found a significant multidecadal variation (MDV) in the long term variation of Northern Hemisphere and Southern Hemisphere TC count in addition to the decreasing trend. The decreasing trend and MDV in the long term variation of TC count correspond well to a similar decreasing trend and MDV of upward mass flux averaged over the TC genesis region and active TC season. It has been shown that the upward mass flux decreases primarily because the rate of increase of dry static stability, which is close to that of surface specific humidity, is much larger than the rate of increase of precipitation, which is nearly the same as that of atmospheric radiative cooling. Thus, it is suggested that the decreasing trend of TC count is mainly caused by the decreasing trend of upward mass flux associated with the increasing dry static stability.
Decreasing trend of tropical cyclone frequency in 228-year high-resolution AGCM simulations - Sugi - 2012 - Geophysical Research Letters - Wiley Online Library
Links to papers....
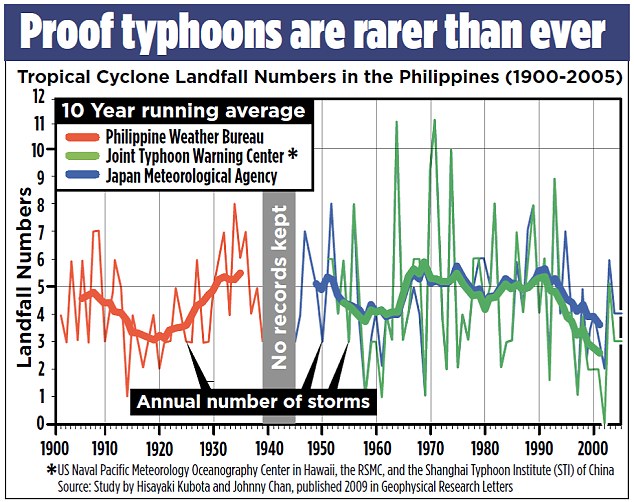
Storminess Of The Little Ice Age | NOT A LOT OF PEOPLE KNOW THAT
Westwall, that's a reference about frequency, but the topic was intensity. Rookie error.
Now, intensity ... here's one paper.
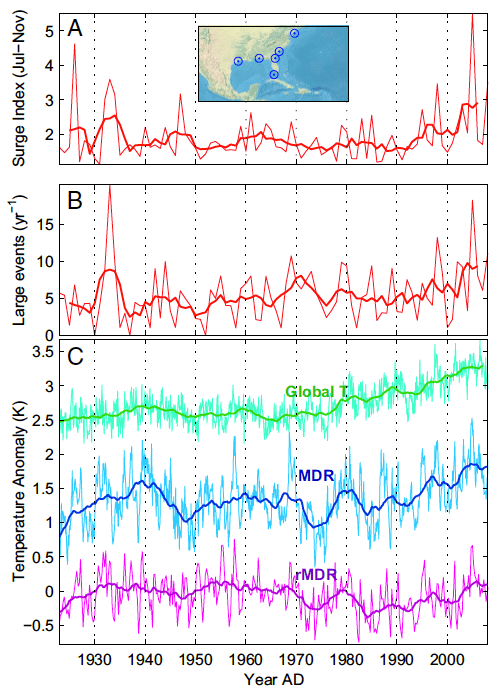
Projected Atlantic hurricane surge threat from rising temperatures
The authors track storm surge levels for hurricanes making landfall in the USA. It's been going up since 1990. The rest of the paper makes predictions, but we don't need to mess with it. We can just see the storm surges have been rising, meaning stronger hurricanes.
Now, intensity ... here's one paper.
Projected Atlantic hurricane surge threat from rising temperatures
The authors track storm surge levels for hurricanes making landfall in the USA. It's been going up since 1990. The rest of the paper makes predictions, but we don't need to mess with it. We can just see the storm surges have been rising, meaning stronger hurricanes.
Westwall, that's a reference about frequency, but the topic was intensity. Rookie error.
Now, intensity ... here's one paper.
Projected Atlantic hurricane surge threat from rising temperatures
The authors track storm surge levels for hurricanes making landfall in the USA. It's been going up since 1990. The rest of the paper makes predictions, but we don't need to mess with it. We can just see the storm surges have been rising, meaning stronger hurricanes.
Bullshit admiral, your claim is "more frequent and more powerful". Both of which have been shown to be false. You're no rookie so I'll just flat out call you a liar. Below are a couple of peer reviewed papers that show the intensity of storms has either remained the same or even decreased a little, there has been NO INCREASE.
Within the last Millennium, the transition between the Medieval Climate Anomaly (MCA; ca. 1000–1300 CE) and the Little Ice Age (LIA; ca. 1400–1800 CE) has been recorded in a global array of climatic and oceanographic proxies. In this study, we review proxy evidence for two alternative hypotheses for the effects of this shift in the North Atlantic region. One hypothesis postulates that the MCA/LIA transition included a weakening of the Atlantic Meridional Overturning Circulation (AMOC) and a transition to more negative
North Atlantic Oscillation (NAO) conditions, resulting in a strong cooling of the North Atlantic region. The alternative hypothesis proposes a MCA/LIA shift to an increased number of storms over the North Atlantic linked to increased mid-latitude cyclogenesis and hence a pervasive positive NAO state. The two sets of proxy records and thus of the two competing hypotheses are then reconciled based on available results from climate model simulations of the last Millennium. While an increase in storm frequency implicates positive NAO, increased intensity would be consistent with negative NAO during the LIA. Such an increase in cyclone intensity could have resulted from the steepening of the meridional temperature gradient as the poles cooled more strongly than the Tropics from the MCA into the LIA.
http://www.climate.unibe.ch/~raible/trouet_gpc_2012.pdf
http://scienceandpublicpolicy.org/images/stories/papers/originals/tropical_cyclones.pdf
"Abstract
Oxygen isotope (δ18O) data in winter months in living coral Porites lutea collected from the Xisha Islands, South China Sea is significantly correlated to the measured winter monsoon velocity (WMV) with a correlation coefficient of 0.63. Based on 40-year (1961–2000) instrumental data, a transfer function between the WMV and the winter δ18O is established: WMV = 2.819 δ18O + 19.615 (N = 40, p < 0.0001). Based on the calculated WMV from δ18O over the past 183 years, the sequence of winter monsoon velocity (WMV) from year 1818 to 2000 in the South China Sea is re-constructed. The sequence can be divided into three stages: the first stage shows a decreasing trend of 0.009 m/s·yr from 1818 to 1954, the second stage indicates an increasing trend of 0.011 m/s·yr from 1955 to 1976, and the last stage shows a decreasing trend of 0.026 m/s·yr from 1977 to 2000. The maximum reduction in winter monsoon velocity over the last 24 years (1977–2000) is approximately 20% of the average over the last 183 years (1918–2000). The variation of wind velocity shows two complete cycles over the past 183 years. In particular, the strongest and weakest winter monsoon velocities in the last two centuries occurred in the 1830s and 1940s, respectively. The variation in winter monsoon velocity in the 20th century is closely linked to the surface temperature of the South China Sea, as well as air temperature over continental China. In addition, the winter monsoon was weak during two warm periods, i.e. the 1940s and 1980s. Statistical analysis of the winter monsoon velocity anomaly as well as the El Niño (warm event) and La Niña (cold event) phenomena indicates that 70% of El Niño events correspond to the weakness of the winter monsoon."
Variation of the winter monsoon in South China Sea over the past 183years: Evidence from oxygen isotopes in coral
SSDD
Gold Member
- Nov 6, 2012
- 16,672
- 1,966
- 280
Bullshit. The intensity of storms around the world have increased. Those storms take lives. For whose deaths do you believe me to be at fault? Repairmen falling off wind turbines?
More bullshit from the fake ocean engineer. The intensity of storms around the world has not increased.
Meanwhile, people froze and starved, and died of disease worldwide as a result of excessive taxes on energy as a result of green policy, turning food into fuel, and green efforts to block power generation ability in third world countries... I could go on listing the sources of the blood on your hands, but we all know about the death and misery spread around the world by "do good" environmentalists.
- Thread starter
- #147
remember when Landsea resigned from the IPCC because of Trenberth's ludicrous statements about hurricanes?
- Prometheus: Chris Landsea Leaves IPCC ArchivesI found it a bit perplexing that the participants in the Harvard press conference had come to the conclusion that global warming was impacting hurricane activity today. To my knowledge, none of the participants in that press conference had performed any research on hurricane variability, nor were they reporting on any new work in the field. All previous and current research in the area of hurricane variability has shown no reliable, long-term trend up in the frequency or intensity of tropical cyclones, either in the Atlantic or any other basin. The IPCC assessments in 1995 and 2001 also concluded that there was no global warming signal found in the hurricane record.
Moreover, the evidence is quite strong and supported by the most recent credible studies that any impact in the future from global warming upon hurricane will likely be quite small. The latest results from the Geophysical Fluid Dynamics Laboratory (Knutson and Tuleya, Journal of Climate, 2004) suggest that by around 2080, hurricanes may have winds and rainfall about 5% more intense than today. It has been proposed that even this tiny change may be an exaggeration as to what may happen by the end of the 21st Century (Michaels, Knappenberger, and Landsea, Journal of Climate, 2005, submitted).
It is beyond me why my colleagues would utilize the media to push an unsupported agenda that recent hurricane activity has been due to global warming. Given Dr. Trenberth’s role as the IPCC’s Lead Author responsible for preparing the text on hurricanes, his public statements so far outside of current scientific understanding led me to concern that it would be very difficult for the IPCC process to proceed objectively with regards to the assessment on hurricane activity. My view is that when people identify themselves as being associated with the IPCC and then make pronouncements far outside current scientific understandings that this will harm the credibility of climate change science and will in the longer term diminish our role in public policy.
Bullshit admiral, your claim is "more frequent and more powerful".
No, it isn't. I've never said such a thing. Abraham, who you responded to, specifically talked only about intensity. Nor does AR5 say such storms are more common. You really owe everyone an apology for misrepresenting them. Next time, just accept the corrections to your bad science. It's no sin to make a mistake. You beclown yourself when you refuse to ever admit any error, and start screaming that everyone who corrects you is a liar.
Your links, as usual, don't say what you claim they say. Do you even read what you post?
Your first was about differences between the Little Ice Age and later times. It had zilch to with recent years.
Your second wasn't a paper. It was a cherrypicking collection piece from your main cherrypicking website, "CO2 science".
Your third was about monsoons in China. Do you really not understand the difference between monsoons and tropical cyclones?
In stark contrast to your feeble cherrypicking, I'll give you 2 more studies that directly address the topic. That puts me up on you 3-0. I win. Have a nice day.
Emanuel 2005
Increasing destructiveness of tropical cyclones over the past 30 years : Abstract : Nature
---
Theory and modelling predict that hurricane intensity should increase with increasing global mean temperatures, but work on the detection of trends in hurricane activity has focused mostly on their frequency and shows no trend. Here I define an index of the potential destructiveness of hurricanes based on the total dissipation of power, integrated over the lifetime of the cyclone, and show that this index has increased markedly since the mid-1970s. This trend is due to both longer storm lifetimes and greater storm intensities. I find that the record of net hurricane power dissipation is highly correlated with tropical sea surface temperature, reflecting well-documented climate signals, including multi-decadal oscillations in the North Atlantic and North Pacific, and global warming. My results suggest that future warming may lead to an upward trend in tropical cyclone destructive potential, andtaking into account an increasing coastal population a substantial increase in hurricane-related losses in the twenty-first century.
---
Eisner 2008
The increasing intensity of the strongest tropical cyclones : Abstract : Nature
---
Atlantic tropical cyclones are getting stronger on average, with a 30-year trend that has been related to an increase in ocean temperatures over the Atlantic Ocean and elsewhere. Over the rest of the tropics, however, possible trends in tropical cyclone intensity are less obvious, owing to the unreliability and incompleteness of the observational record and to a restricted focus, in previous trend analyses, on changes in average intensity. Here we overcome these two limitations by examining trends in the upper quantiles of per-cyclone maximum wind speeds (that is, the maximum intensities that cyclones achieve during their lifetimes), estimated from homogeneous data derived from an archive of satellite records. We find significant upward trends for wind speed quantiles above the 70th percentile, with trends as high as 0.3 plusminus 0.09 m/s/yr (s.e.) for the strongest cyclones. We note separate upward trends in the estimated lifetime-maximum wind speeds of the very strongest tropical cyclones (99th percentile) over each ocean basin, with the largest increase at this quantile occurring over the North Atlantic, although not all basins show statistically significant increases. Our results are qualitatively consistent with the hypothesis that as the seas warm, the ocean has more energy to convert to tropical cyclone wind.
---
- Dec 18, 2013
- 136,659
- 27,997
- 2,180
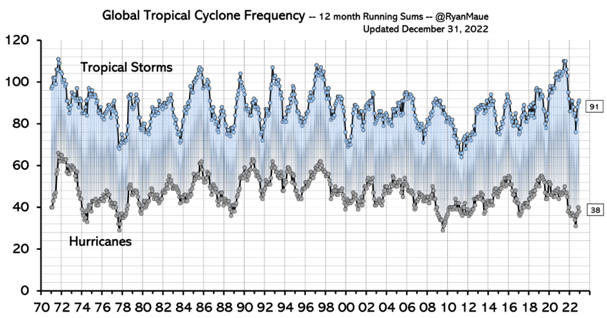
Not that I want to hop in the middle of something, but couldn't understand why you only showed back to 1970? Where are the stats that show since day 1 of the earth. You made a claim that is cherry picked at best. 1970? So there were never any hurricanes before 1970?Bullshit admiral, your claim is "more frequent and more powerful".
No, it isn't. I've never said such a thing. Abraham, who you responded to, specifically talked only about intensity. Nor does AR5 say such storms are more common. You really owe everyone an apology for misrepresenting them. Next time, just accept the corrections to your bad science. It's no sin to make a mistake. You beclown yourself when you refuse to ever admit any error, and start screaming that everyone who corrects you is a liar.
Your links, as usual, don't say what you claim they say. Do you even read what you post?
Your first was about differences between the Little Ice Age and later times. It had zilch to with recent years.
Your second wasn't a paper. It was a cherrypicking collection piece from your main cherrypicking website, "CO2 science".
Your third was about monsoons in China. Do you really not understand the difference between monsoons and tropical cyclones?
In stark contrast to your feeble cherrypicking, I'll give you 2 more studies that directly address the topic. That puts me up on you 3-0. I win. Have a nice day.
Emanuel 2005
Increasing destructiveness of tropical cyclones over the past 30 years : Abstract : Nature
---
Theory and modelling predict that hurricane intensity should increase with increasing global mean temperatures, but work on the detection of trends in hurricane activity has focused mostly on their frequency and shows no trend. Here I define an index of the potential destructiveness of hurricanes based on the total dissipation of power, integrated over the lifetime of the cyclone, and show that this index has increased markedly since the mid-1970s. This trend is due to both longer storm lifetimes and greater storm intensities. I find that the record of net hurricane power dissipation is highly correlated with tropical sea surface temperature, reflecting well-documented climate signals, including multi-decadal oscillations in the North Atlantic and North Pacific, and global warming. My results suggest that future warming may lead to an upward trend in tropical cyclone destructive potential, andtaking into account an increasing coastal population a substantial increase in hurricane-related losses in the twenty-first century.
---
Eisner 2008
The increasing intensity of the strongest tropical cyclones : Abstract : Nature
---
Atlantic tropical cyclones are getting stronger on average, with a 30-year trend that has been related to an increase in ocean temperatures over the Atlantic Ocean and elsewhere. Over the rest of the tropics, however, possible trends in tropical cyclone intensity are less obvious, owing to the unreliability and incompleteness of the observational record and to a restricted focus, in previous trend analyses, on changes in average intensity. Here we overcome these two limitations by examining trends in the upper quantiles of per-cyclone maximum wind speeds (that is, the maximum intensities that cyclones achieve during their lifetimes), estimated from homogeneous data derived from an archive of satellite records. We find significant upward trends for wind speed quantiles above the 70th percentile, with trends as high as 0.3 plusminus 0.09 m/s/yr (s.e.) for the strongest cyclones. We note separate upward trends in the estimated lifetime-maximum wind speeds of the very strongest tropical cyclones (99th percentile) over each ocean basin, with the largest increase at this quantile occurring over the North Atlantic, although not all basins show statistically significant increases. Our results are qualitatively consistent with the hypothesis that as the seas warm, the ocean has more energy to convert to tropical cyclone wind.
---
And then a 30 year trend? What's the trend that every 30 years there are instense storms?
Not that I want to hop in the middle of something, but couldn't understand why you only showed back to 1970?
No, all the papers examined data older than that. They just pointed out the upward trends started then. What a coincidence, that's the same time the warming trend started. It's not proof, but it is a correlation.
Where are the stats that show since day 1 of the earth. You made a claim that is cherry picked at best. 1970? So there were never any hurricanes before 1970?
The claim was that hurricanes have been getting more intense. That's not cherrypicked. It's a statement, one that was supported with data. It's not proof that the increase was due to global warming, but it was not presented as another data point, and not absolute proof.
And then a 30 year trend? What's the trend that every 30 years there are instense storms?
Nope, since the data was examined for longer than 30 years.
Last edited:
- Aug 10, 2009
- 168,037
- 16,519
- 2,165
- Banned
- #151
Consensus folks, listen up: 90% is not the same as more than 90%.
Consensus junk science is junk science: your opinion counts for nothing with 80% of the country.
Consensus junk science is junk science: your opinion counts for nothing with 80% of the country.
Similar threads
- Replies
- 12
- Views
- 4K
J
- Replies
- 23
- Views
- 3K
R
Latest Discussions
- Replies
- 1K
- Views
- 6K
- Replies
- 5
- Views
- 31
- Replies
- 65
- Views
- 947
Forum List
-
-
-
-
-
Political Satire 8087
-
-
-
-
-
-
-
-
-
-
-
-
-
-
-
-
-
-
-
ObamaCare 781
-
-
-
-
-
-
-
-
-
-
-
Member Usernotes 471
-
-
-
-
-
-
-
-
-
-