Late last week, a study published by NASA scientists in the Journal of Glaciology made the surprising claim that the gigantic continent of Antarctica is actually gaining ice, rather than losing it, to the tune of 82 gigatons (or billion metric tons) per year from 2003 to 2008.
The study has drawn massive amounts of media attention — and no wonder. It contradicts numerous prior scientific claims, including a 2012 study in Science by a small army of polar scientists, a study from earlier this year in Earth and Planetary Science Letters (which found 92 gigatons of net losses per year) and this 2014 study in Geophysical Research Letters (160 gigatons of net losses per year). It also contradicts assertions by the leading consensus body of climate science, the U.N.’s Intergovernmental Panel on Climate Change, which stated in 2013 that Antarctica is “losing mass” and that this process is accelerating. That statement was itself based on multiple studies showing Antarctic ice loss.
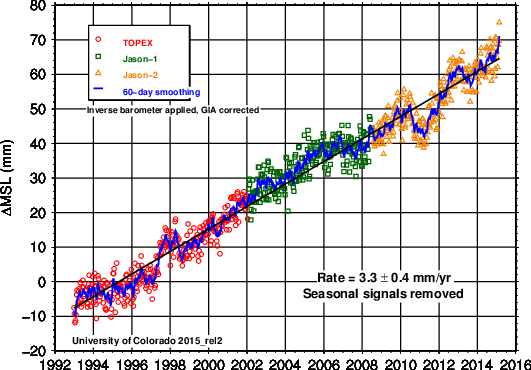
Not only does the new research fly in the face of all of this — if true, it also raises serious questions about our current understanding of sea level rise. If Antarctica is actually gaining ice, that means that a significant percentage of the current rise of the seas, estimated at roughly 3.22 millimeters per year by NASA itself, must be coming from elsewhere. (It takes 360 gigatons of ice to raise seas by 1 millimeter).
No wonder, then, that a number of researchers have been quoted expressing skepticism about the new research, even as climate change doubters have had a field day — adding the study to an argumentative arsenal that previously included misleading claims about growing Antarctic sea ice.
So what’s going on here — and what should you make of the new claim that Antarctica isn’t losing ice or raising our seas?
A controversial NASA study says Antarctica is gaining ice. Here’s why you should be skeptical
***************************************************************************************************
The number of studies that found Antarctic ice decreasing - and at far larger rates than Zwally found it to be increasing - outnumber Zwally a good ten to one. And, if Zwally is correct, hundreds of gigatons of ice is melting annually somewhere else without anyone noticing it.
Besides, surely someone here recalls that since the early 1980s, it has been understood that global warming would INCREASE Antarctic precipitation.
Get a grip folks. AGW is still widely accepted science. Climate change denial is still fringe nonsense.
The study has drawn massive amounts of media attention — and no wonder. It contradicts numerous prior scientific claims, including a 2012 study in Science by a small army of polar scientists, a study from earlier this year in Earth and Planetary Science Letters (which found 92 gigatons of net losses per year) and this 2014 study in Geophysical Research Letters (160 gigatons of net losses per year). It also contradicts assertions by the leading consensus body of climate science, the U.N.’s Intergovernmental Panel on Climate Change, which stated in 2013 that Antarctica is “losing mass” and that this process is accelerating. That statement was itself based on multiple studies showing Antarctic ice loss.
Not only does the new research fly in the face of all of this — if true, it also raises serious questions about our current understanding of sea level rise. If Antarctica is actually gaining ice, that means that a significant percentage of the current rise of the seas, estimated at roughly 3.22 millimeters per year by NASA itself, must be coming from elsewhere. (It takes 360 gigatons of ice to raise seas by 1 millimeter).
No wonder, then, that a number of researchers have been quoted expressing skepticism about the new research, even as climate change doubters have had a field day — adding the study to an argumentative arsenal that previously included misleading claims about growing Antarctic sea ice.
So what’s going on here — and what should you make of the new claim that Antarctica isn’t losing ice or raising our seas?
A controversial NASA study says Antarctica is gaining ice. Here’s why you should be skeptical
***************************************************************************************************
The number of studies that found Antarctic ice decreasing - and at far larger rates than Zwally found it to be increasing - outnumber Zwally a good ten to one. And, if Zwally is correct, hundreds of gigatons of ice is melting annually somewhere else without anyone noticing it.
Besides, surely someone here recalls that since the early 1980s, it has been understood that global warming would INCREASE Antarctic precipitation.
Get a grip folks. AGW is still widely accepted science. Climate change denial is still fringe nonsense.
Last edited: