Navigation
Install the app
How to install the app on iOS
Follow along with the video below to see how to install our site as a web app on your home screen.

Note: This feature currently requires accessing the site using the built-in Safari browser.
More options
You are using an out of date browser. It may not display this or other websites correctly.
You should upgrade or use an alternative browser.
You should upgrade or use an alternative browser.
Definite Proof of Global Warming Found...
- Thread starter Lumpy 1
- Start date

Granny says we've had some purt cool weather `round here lately...
U.N.: 2015 will be warmest year on record
Nov. 25, 2015 - Temperature data suggests western North America, and large parts of South America, Africa and southern and eastern Eurasia have witnessed to most dramatic heat spells.
U.N.: 2015 will be warmest year on record
Nov. 25, 2015 - Temperature data suggests western North America, and large parts of South America, Africa and southern and eastern Eurasia have witnessed to most dramatic heat spells.
There are still a few days left in November, but scientists with the United Nations are already willing to declare 2015 the hottest year on record. The statement is second time this month the U.N.-sanctioned World Meteorological Organization has declared a major a climatic threshold breached. In early November, WMO scientists reported that for three months this spring the concentration of CO2 in the atmosphere averaged more than 400 parts per million, an all-time high. Now, U.N. scientists say Earth's average temperature is 1 degree Celsius hotter than pre-industrial temperatures.
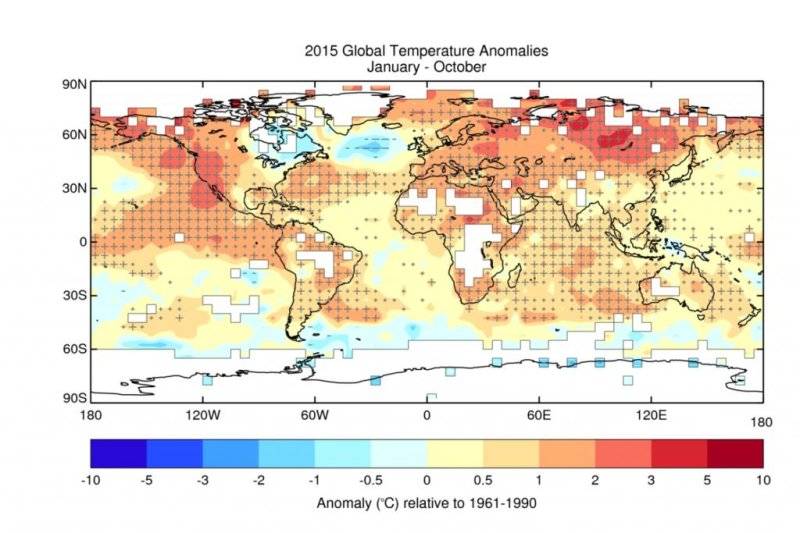
A map shows the globe's average temperature between January and October of 2015, a stretch of high temps scientists all but guarantee will place 2015 as the hottest on record.
Scientists also declared 2011 to 2015 the hottest five-year period on record. "The state of the global climate in 2015 will make history as for a number of reasons," WMO Secretary-General Michel Jarraud said in a press release. "Levels of greenhouse gases in the atmosphere reached new highs." "2015 is likely to be the hottest year on record, with ocean surface temperatures at the highest level since measurements began," Jarraud continued. "It is probable that the 1 degree Celsius threshold will be crossed. This is all bad news for the planet."
The declaration comes in the form of a "preliminary statement," as the organization's full report on both 2015 and the last five years won't be released until after the Paris climate talks. Temperature data suggests western North America, and large parts of South America, Africa and southern and eastern Eurasia have witnessed the most dramatic heat spells. The statement also linked the warming planet to stronger storms, more dramatic droughts and rising sea levels. Global sea level averages during the first half of the year were the highest since records began in 1993.
U.N.: 2015 will be warmest year on record
Mr. H.
Diamond Member
If there's money to be had from a contrived crisis, Liberals can't be far behind.
The lower middle class will bear the burden of this carefully orchestrated scheme.
Spend trillions of dollars, unemploy tens of millions, decimate entire industries...
in the theoretical hope of reducing the world's global mean temperature by...
.018 degrees celsius.
Fuck you bitches.
The lower middle class will bear the burden of this carefully orchestrated scheme.
Spend trillions of dollars, unemploy tens of millions, decimate entire industries...
in the theoretical hope of reducing the world's global mean temperature by...
.018 degrees celsius.
Fuck you bitches.
Mr. H.
Diamond Member
Agriculture is the most hydrocarbon-dependent industry on the planet.
Still, the farmer fucks you in the ass while you suck the farmer's cock.
Taste the farmer cum.
Still, the farmer fucks you in the ass while you suck the farmer's cock.
Taste the farmer cum.
Mr. H.
Diamond Member
Why isn't agriculture under the EPA's microscope as is the fossil fuel industry? 
Answer: Votes, lobbying power, and political contributions.
The BP disaster in the Gulf of Mexico pales in comparison to the effects of agriculture on that body of water. Farmers have turned it into a cesspool over the last 100 years.
Answer: Votes, lobbying power, and political contributions.
The BP disaster in the Gulf of Mexico pales in comparison to the effects of agriculture on that body of water. Farmers have turned it into a cesspool over the last 100 years.

Mr. H.
Diamond Member
As the saying goes, if you don't like the weather - stick around for a few days and global warming will take care of it.
But wait! There's more! If we spend tens of trillions of dollars, decimate entire industries, de-employ hundreds of millions worldwide... then we may theoretically be able to reduce the world's mean temperature by .018 degrees celsius. Within the next 20 years.
But wait! There's more! If we spend tens of trillions of dollars, decimate entire industries, de-employ hundreds of millions worldwide... then we may theoretically be able to reduce the world's mean temperature by .018 degrees celsius. Within the next 20 years.
Heatsinks, like Louisville, Ky. have warmer temps due to the 'bowl effect'...
Study: Surface Temps Lower at 410 Weather Stations With ‘Minimal Artificial Impact’
December 17, 2015 – Surface temperatures recorded over three decades at 410 ideally situated weather stations are markedly lower than temperatures recorded at stations located near multiple heatsinks, according to a new study presented Thursday at the 2015 fall meeting of the American Geophysical Union in San Francisco.
See also:
You think this year is hot? 2016 tipped to break annual global heat records again
December 18, 2015 - The remarkable global heat experienced in 2015 is not yet over and already forecasters are predicting next year will be hotter again - marking three years in a row of record annual warmth.
Study: Surface Temps Lower at 410 Weather Stations With ‘Minimal Artificial Impact’
December 17, 2015 – Surface temperatures recorded over three decades at 410 ideally situated weather stations are markedly lower than temperatures recorded at stations located near multiple heatsinks, according to a new study presented Thursday at the 2015 fall meeting of the American Geophysical Union in San Francisco.
The study examined the 30-year temperature records collected from a subset of 410 weather stations belonging to the National Oceanographic and Atmospheric Administration’s (NOAA) Historical Climatology Network (USHCN) of 1,218 stations. “A 410-station subset of U.S. Historical Climatology stations is identified that experienced no changes in time of observation or station moves during the 1979-2008 period. These stations are classified on proximity to artificial surfaces, buildings, and other such objects with unnatural thermal mass,” according to the study, entitled Comparing of Temperature Trends Using an Unperturbed Subset of the U.S. Historical Climatology Network. “The United States temperature trends estimated from the relatively few stations in the classes with minimal artificial impact are found to be collectively about 2/3 as large as US trends estimated in the classes with greater expected artificial impact,” the researchers report.

USHCN weather station in Marysville, Calif. is located next to an asphalt parking lot and near several air conditioning exhaust vents.
The study “suggests that the trend for U.S. temperature will need to be corrected. We also see evidence of this same sort of siting problem around the world at many other official weather stations, suggesting that the same upward bias on trend also manifests itself in the global temperature record.” However, “the data suggests that the divergence between well and poorly sited stations is gradual, not a result of spurious step change due to poor metadata,” they concluded. “The majority of weather stations used by NOAA to detect climate change temperature signal have been compromised by encroachment of artificial surfaces like concrete, asphalt, and heat sources like air conditioner exhausts. This study demonstrates conclusively that this issue affects temperature trend and that NOAA’s methods are not correcting for this problem, resulting in an inflated temperature trend,” said lead author Anthony Watts, who blogs at Watts Up With That?

USHNC weather stations depicted in red or orange have an estimated error rate of more than 2 degrees Celsius due to their proximity to artificial heat sources, according to a Dec. 2015 study.
The best stations (Class 1) are defined as those situated on “flat and horizontal ground surrounded by a clear surface with a slope below 1/3 (<19 deg.). Grass/low vegetation ground cover <10 centimeters high. Sensors located at least 100 meters from artificial heating or reflecting surfaces, such as buildings, concrete surfaces, and parking lots. Far from large bodies of water, except if it is representative of the area, and then located at least 100 meters away. No shading when the sun elevation >3 degrees,” according to NOAA's 2002 Site Information Handbook. The worst (Class 5) have their “temperature sensor located next to/above an artificial heating source, such as a building, roof top, parking lot, or concrete surface.” “The poorest sites tend to be warmer,” explained co-author John Nielsen-Gammon, professor of atmospheric sciences at Texas A&M University.
Study: Surface Temps Lower at 410 Weather Stations With ‘Minimal Artificial Impact’
See also:
You think this year is hot? 2016 tipped to break annual global heat records again
December 18, 2015 - The remarkable global heat experienced in 2015 is not yet over and already forecasters are predicting next year will be hotter again - marking three years in a row of record annual warmth.
The prediction, by Britain's Met Office, for the possibility of a trio of record-breaking years comes just days after almost 200 nations agreed in Paris to a new global agreement to tackle climate change. Under the pact, to take effect from 2020, nations would review efforts to curb greenhouse gas emissions every five years with the aim of keeping temperature increases to "well below 2 degrees" of pre-industrial levels. The Met Office's release on Thursday of its annual global temperature forecast comes as south-eastern Australia swelters in what is expected to be record early-season heat. Adelaide is on course to mark four days in a row of 40-plus days by Saturday, the first time such a run has been recorded in December.

The Met Office said this year was on track to eclipse 2014 as the hottest year for average sea- and land-surface temperatures. Using data for the first 10 months of 2015, the temperature was 0.72 degrees above the 1961-90 average and well above 2014's record 0.61 degrees above the norm. The Met Office predicts 2016 will spike even higher, with a central prediction for a temperature anomaly of 0.84 degrees above the 1961-90 average. "This forecast suggests that, by the end of 2016, we will have seen three record, or near-record years in a row for global temperatures," Adam Scaife, head of long-range prediction at the Met Office, said.
Australian heat
Climatologists say the record heat is the result of the background climate change triggered by human activities, such as burning of fossil fuels, combining with natural cycles, particularly the monster El Nino in the Pacific. During El Nino years, altered Pacific wind patterns lead to the ocean tending to absorb less heat from the atmosphere. Rainfall also tends to shift eastwards, leaving eastern Australia relatively dry. With less moisture available during dry years for evaporative cooling, temperatures - and the associated bushfire risks - can soar in spring and summer across south-eastern Australia.

The Bureau of Meteorology is forecasting severe heatwave conditions over almost all of Victoria from Friday to Sunday, with pockets to Melbourne's east and south-east NSW likely to experience extreme conditions. While blasts of summer heat are not uncommon, it is unprecedented to have such warmth in places such as Adelaide this side of January.
Still chart-topping
Last edited:
Similar threads
- Replies
- 362
- Views
- 3K
- Replies
- 25
- Views
- 398
- Replies
- 17
- Views
- 259
- Replies
- 188
- Views
- 2K
Latest Discussions
- Replies
- 1
- Views
- 2
- Replies
- 147
- Views
- 527
- Replies
- 49
- Views
- 186
- Replies
- 621
- Views
- 3K
Forum List
-
-
-
-
-
Political Satire 8018
-
-
-
-
-
-
-
-
-
-
-
-
-
-
-
-
-
-
-
ObamaCare 781
-
-
-
-
-
-
-
-
-
-
-
Member Usernotes 467
-
-
-
-
-
-
-
-
-
-