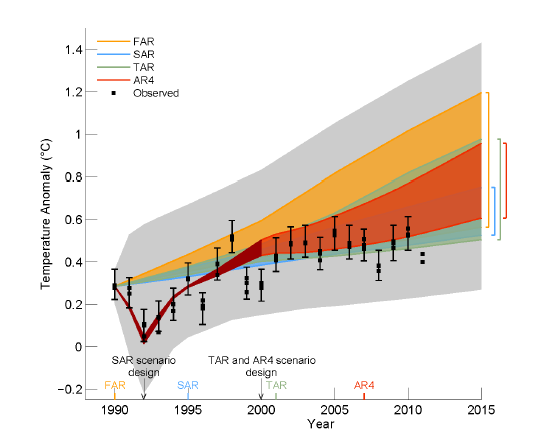
the pro-AGW crowd here keeps saying that their predictions are good, and if anything too conservative. does this include the IPCC temperature projections? they certainly seem exaggeratedly high in every edition of the IPCC so far. at least to me. can someone tell me how they consider these predictions are consistent with reality?