In Support of the A in AGW

Your attempt at diversion...not mine...the fact remains that cricks observed and measured radiation from the atmosphere were made by an instrument that had been cooled to a temperature lower than that of the atmosphere....one does not need a cooled instrument to measure energy coming in from the sun, why then, if according to the greenhouse hypothesis twice as much energy is coming to the earth from the atmosphere than comes from the sun must one have a cooled instrument in order to measure it....

As we've pointed out to you before, you can buy thermal imagers right now which measure the backradiation and which don't need to be cooled.

And as I have pointed out to you, they are measuring changes within internal thermopiles...not actual incoming or outgoing radiation...fooling yourself with instrumentation is not evidence of anything other than you don't understand the instrument.

Sorry hairball, but for all the bluster you warmers have spewed regarding the overwhelming body of evidence supporting the A in AGW, what your buds have presented, as you have presented nothing doesn't rise to the level of evidence of anything other than that radiation can be measured and quantified....that never was in question...there is no evidence to support the A in AGW.
 
Hoooo boy, back to the smart photons again. Oh well................

Show me where these photons with low output due to their cooler temp will affect a warmer atmosphere. And just how does water inhibit this through absorption and convection.

Damned interesting thread....isn't it. For all their bluster about evidence this and evidence that, it is clear that they have nothing supporting the A in AGW....plenty of evidence for things that were never in question, but nothing....nada...zip...zero to support that all important A in AGW....pure politics and money...never was anything else.
 
Hoooo boy, back to the smart photons again. Oh well................

Show me where these photons with low output due to their cooler temp will affect a warmer atmosphere. And just how does water inhibit this through absorption and convection.
Damned interesting thread....isn't it. For all their bluster about evidence this and evidence that, it is clear that they have nothing supporting the A in AGW....plenty of evidence for things that were never in question, but nothing....nada...zip...zero to support that all important A in AGW....pure politics and money...never was anything else.

They use terms that have little meaning to real scientists and are designed to confuse the general public. "Back Radiation" is really a known fact of all matter emitting IR at their temperature. I once started a thread showing how the terminology was paramount in the deception. This thread actually proves that hypothesis. Its actually very enlightening.

One of the main problems, which causes the debate to cease, is the use of generic terms which include subsets of other items which may or may not be root causes.

Lets take the Term "Global Warming". The term insinuates that the earth is warming but what it does not do is determine what the individual or cumulative causes are for it. For the purposes of this thread this term is not acceptable as it fails to identify whether the cause in warming is attributed to man or attributed to natural process.

As you can see the choice of terms is ambiguous and leaves open the problems of misinterpretation or outright deceitful misdirection.

Natural Variation = Processes which are natural and occur without mans influence.

Natural Forcing = Specific definable processes which triggers warming or cooling.

Man Created Forcing = The specific contribution which results in warming or cooling. (Also known as Anthropogenic Forcing) and may enhance/mute natural ones

Land Use Induced = Changes in local areas which are due to the lands use. (roads, buildings, etc which result in the Urban Heat Island or other potential changes from the natural state of the area)

Pollution = Man created products which cause harm to the natural environment. Naturally occurring gasses and those items which occur through the natural cycles of the earth are not considered pollutants. (CO2 can be both but be prepared to show how you determined what was naturally caused and what is man created.) [Negative impacts on health do not occur below 6,000ppm - United States Navy determination on long term submarine operations].

Consensus = Is not a scientific term and alludes to the possibility that there is no other meaning, process or reason for what we observe. It is inherently anti-science and political (mob rule).

With the majority of the troublesome terms well defined lets try this one again..

The IPCC makes the claim that all of the warming post 1950 is man caused due to the increase of CO2 in our atmosphere. So lets see just what the natural process was prior to 1950 and compare it to that time span.

Lets define the most recent natural rate of warming which I will do in my next post and then we will try to hash this out..
 
My question is where is this evidence? I have been asking for decades to see some actual observed, measured, quantified, empirical evidence gathered from out here in the real, observable, measurable quantifiable world that supports the anthropogenic component of the AGW hypothesis.

And we've given it to you, over and over. You just choose to lie about that.

Stratospheric cooling. Is there a natural explanation for that? No. Hence, "A".

Increase in backradiation. Is there a natural explanation for that? No. Hence, "A".

Decrease in outgoing longwave in GHG bands. Is there a natural explanation for that? No. Hence, "A".

Actually stratospheric cooling is explained in the increased amount of convection and how it releases heat when the droplets form. This region also comes with some heat loss as the re-nucleated molecules absorbed heat from that layer. Again Observed Evidence trumps your hype..

The increase in OLWIR shows this fact.
 
Last edited:
The spectrum below is for the real Sun's output and shows the various absorbers.

SOLARS.jpg


Solar spectrum (A) above the atmosphere, (B) near the Earth's surface and (C) the spectrum detectable by the eye, The x-axis is wavelength in microns. The difference between A and B represents the albedo; the fraction of the incoming solar radiation that is reflected to space. No spectrum of that seems to be available, but I'm still trying to find one. According to the K/T diagram the radiation absorbed by the atmosphere amounts to 67 W/m2 with only 10 W/m2 of that absorbed by the stratosphere.


Carbon Dioxide Infrared Spectrum

There are several transitions of the CO2 molecule that contribute to its IR spectrum and which are relevant to the understanding of its role in global warming. For an apparently simple triatomic molecule its IR spectrum is quite complex. The relevant transitions are shown in Figure 1.

Barrett Bellamy Climate - Greenhouse gas spectra

Much more at this site. Yes, Virginia, there are GHGs and they impact the temperature of the atmosphere and oceans, as we are finding out right now.


I love it... You equate potential with 'does' when empirical evidence shows it does not.
'Empirical' evidence that you never link to. LOL. All that education, and you don't know how to find a site that would demonstrate your 'empirical' evidence. Amazing.

I posted the real world data in post 4 of this thread showing the premise you gave as false.. Yet you ignore it, why?

Your premise must have results that are observable and defineable in the real world.. Models are fantasy land and not empirical evidence of any kind.
 
Last edited:
The spectrum below is for the real Sun's output and shows the various absorbers.

SOLARS.jpg


Solar spectrum (A) above the atmosphere, (B) near the Earth's surface and (C) the spectrum detectable by the eye, The x-axis is wavelength in microns. The difference between A and B represents the albedo; the fraction of the incoming solar radiation that is reflected to space. No spectrum of that seems to be available, but I'm still trying to find one. According to the K/T diagram the radiation absorbed by the atmosphere amounts to 67 W/m2 with only 10 W/m2 of that absorbed by the stratosphere.


Carbon Dioxide Infrared Spectrum

There are several transitions of the CO2 molecule that contribute to its IR spectrum and which are relevant to the understanding of its role in global warming. For an apparently simple triatomic molecule its IR spectrum is quite complex. The relevant transitions are shown in Figure 1.

Barrett Bellamy Climate - Greenhouse gas spectra

Much more at this site. Yes, Virginia, there are GHGs and they impact the temperature of the atmosphere and oceans, as we are finding out right now.


I love it... You equate potential with 'does' when empirical evidence shows it does not.
'Empirical' evidence that you never link to. LOL. All that education, and you don't know how to find a site that would demonstrate your 'empirical' evidence. Amazing.
he did here:

Well lets put some context to your post SSDD.. And a few facts..

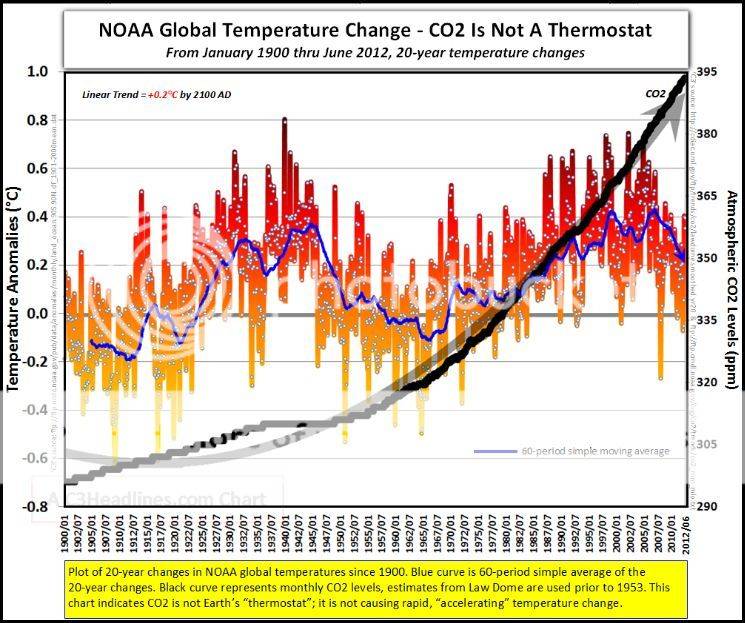
Below are two rates of warming from the Hadcrut3 lower troposphere. One is from the period 1900 through 1950 and the the other is 1951 through 2000. Below each is the rate of warming.

trend


The trend for the period 1900-1950 is 0.51 deg C or 0.103/decade

This trend occurred before CO2 became a rapidly increasing according to the IPCC and is near or is the Natural Variational rate.

The trend for 1951-2000 is 0.50 deg C or 0.100 deg C/decade.

This means that the two rates of warming are statistically insignificant DESPITE the rapid rise in CO2 and equal to NATURAL VARIATION..

GlobaltempChange.jpg


So by simple observation we can see the problem with the hypothesis of runaway temp caused by CO2. During the time they claim runway rise it was nothing of the sort and even given the rise in CO2 there was no discernible increase in that natural rise.

Just some facts for the record...
 
BillyBob. You quoted this graph once before and it was never ever published by NOAA, despite the fraudulant title. It came from http://i857.photobucket.com/albums/ab140/Billy_Bob_photos/GlobaltempChange.jpg. I think you or someone else Photoshopped that Photobucket photo.

Please cite a legitimate NOAA source and not something from your personal bucket of photos.
What I said was, the data used for the graph came from NOAA.. A failure to read.again...
and?
 
BillyBob. You quoted this graph once before and it was never ever published by NOAA, despite the fraudulant title. It came from http://i857.photobucket.com/albums/ab140/Billy_Bob_photos/GlobaltempChange.jpg. I think you or someone else Photoshopped that Photobucket photo.

Please cite a legitimate NOAA source and not something from your personal bucket of photos.
What I said was, the data used for the graph came from NOAA.. A failure to read.again...
That is a flat-out lie. That graph did not come from NOAA and you know it. It was photoshopped. Either by you or someone else.

Look at the link for the graph below. This came directly from NOAA. It shows a temperature rise that is quite different from the one you posted.
global-temp-and-co2-1880-2009.gif


http://www1.ncdc.noaa.gov/pub/data/cmb/images/indicators/global-temp-and-co2-1880-2009.gif
you know, reading comprehension is very important at times. He stated the data in the graph was from NOAA not the graph. wow, he even reposted it for ya.
 
Interesting how the old atmospheric "Hot Spot" never appears as the modeling says it should.

upload_2016-4-21_11-34-9.png


Source

Without amplification the A in AGW fails. The question in my mind is why are we seeing just 1/2 of warming that is expected in lab experiments? That does not even include non-CO2 causes to boot. So the warming we have seen is far below what the LOG effect of CO2 in the lab has shown.

Water vapor and clouds are the answer as we have seen the increasing outgoing LWIR from the stratosphere. Water vapor is a negative forcing at our current temperature. Dr Roy Spencer hypothesizes that during ice ages this flips to positive but at warmer temps it allows LWIR to escape despite retardation by CO2 in the lower atmosphere.
 
Last edited:
BillyBob. You quoted this graph once before and it was never ever published by NOAA, despite the fraudulant title. It came from http://i857.photobucket.com/albums/ab140/Billy_Bob_photos/GlobaltempChange.jpg. I think you or someone else Photoshopped that Photobucket photo.

Please cite a legitimate NOAA source and not something from your personal bucket of photos.
What I said was, the data used for the graph came from NOAA.. A failure to read.again...
That is a flat-out lie. That graph did not come from NOAA and you know it. It was photoshopped. Either by you or someone else.

Look at the link for the graph below. This came directly from NOAA. It shows a temperature rise that is quite different from the one you posted.
global-temp-and-co2-1880-2009.gif


http://www1.ncdc.noaa.gov/pub/data/cmb/images/indicators/global-temp-and-co2-1880-2009.gif

The data was taken from NOAA before the magic Karl Et Al made massive adjustments to it.. I noticed you cling to adjusted, modeled and molested crap.
 
Last edited:
The data was taken from NOAA before the magic Karl Et Al made massive adjustments to it.. I noticed you cling to adjusted, modeled and molested crap.
Prove it. What is the NOAA source. Photobucket is not a reliable source.
 
Look at the link for the graph below. This came directly from NOAA. It shows a temperature rise that is quite different from the one you posted.
global-temp-and-co2-1880-2009.gif


http://www1.ncdc.noaa.gov/pub/data/cmb/images/indicators/global-temp-and-co2-1880-2009.gif

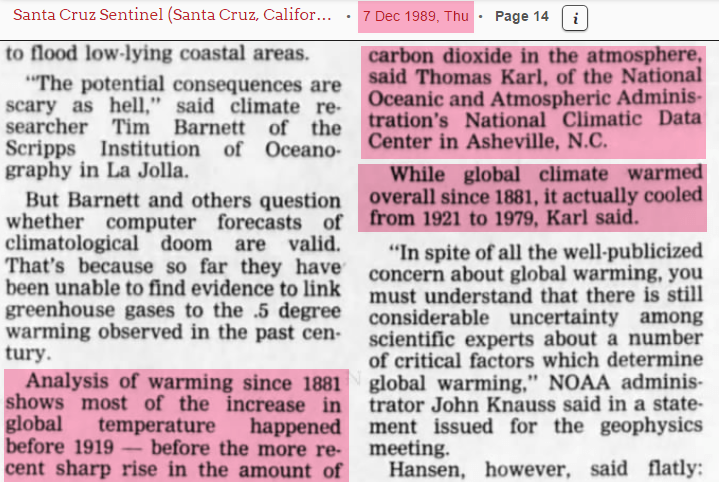
That graph has some troubling problems of its own and the fact that it came from NOAA makes it all the more troubling. In 1989 NOAA said that they had observed a decline in temperature between the years of 1921 and 1979...that decline is not evident in your graph...why not? They also stated that most of the warming since 1881 till that date (1989) had taken place prior to 1919. Your graph doesn't reflect that trend either..why? The discrepancy between what your graph says and what NOAA said in 1989 is the result of a systematic raising of modern temperatures and an equally systematic lowering of temperatures further in the past....your graph reflects that elegantly.

Can you offer up a rational, scientifically valid reason for such drastic changes in the temperature record? Do you really believe that altering the record to that degree has made it more accurate?

Image-131-1-1.png
 
The data was taken from NOAA before the magic Karl Et Al made massive adjustments to it.. I noticed you cling to adjusted, modeled and molested crap.

Your own graph shows evidence of quite a bit of adjustment as well...refer to the newspaper clipping from 1989 in the post above....in 1989 NOAA clearly stated that they saw a cooling trend between the years of 1921 and 1979...that trend had already been adjusted out of existence by the time the data for your graph was used...They also said that most of the warming since 1882 till that date (1989) had taken place prior to 1919....another trend that had already been adjusted out of existence by the time the data was used to create your graph...

There is little doubt that the temperature record has been manipulated and altered out of all reason and bears little, if any resemblance to the actual historical record if it even still exists.
There have been over 90 alterations to the historical record in the last 15 years by NOAA, NASA, and GISS, that we know about... Its been molested so badly it is no longer credible.

In my work, I have to rely on data sets taken from other papers, previously published, simply becasue the base line is so irreparably damaged. Data sets from just 15 years ago are totally unrecognizable in comparison to today's fantasy published by NOAA.

Take the graph Wei Wei is having a hard time with, that was data taken in 2012 from NOAA's own published data set. Just try to retrieve that data set today and you will find that it has been removed from the site. Only the heavily adjusted and molested data is available today.

Thank God for reputable scientists who have downloaded and kept these data sets monthly. I have been trying to get a few to publish the gradual changes done over the years. I was totally flabbergasted that there had been 90 significant changes to the record in the last 15 years...
 
Last edited:

Forum List

Back
Top