In Support of the A in AGW

The spectrum below is for the real Sun's output and shows the various absorbers.

SOLARS.jpg


Solar spectrum (A) above the atmosphere, (B) near the Earth's surface and (C) the spectrum detectable by the eye, The x-axis is wavelength in microns. The difference between A and B represents the albedo; the fraction of the incoming solar radiation that is reflected to space. No spectrum of that seems to be available, but I'm still trying to find one. According to the K/T diagram the radiation absorbed by the atmosphere amounts to 67 W/m2 with only 10 W/m2 of that absorbed by the stratosphere.


Carbon Dioxide Infrared Spectrum

There are several transitions of the CO2 molecule that contribute to its IR spectrum and which are relevant to the understanding of its role in global warming. For an apparently simple triatomic molecule its IR spectrum is quite complex. The relevant transitions are shown in Figure 1.

Barrett Bellamy Climate - Greenhouse gas spectra

Much more at this site. Yes, Virginia, there are GHGs and they impact the temperature of the atmosphere and oceans, as we are finding out right now.
again, if you have less LWIR you can't increase your magic back radiation. you can't have it both ways dude.
 
Well lets put some context to your post SSDD.. And a few facts..

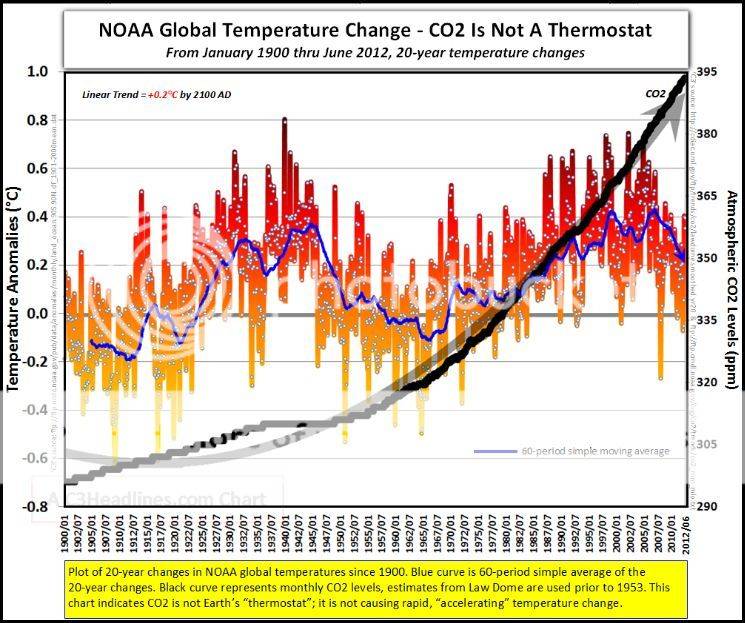
Below are two rates of warming from the Hadcrut3 lower troposphere. One is from the period 1900 through 1950 and the the other is 1951 through 2000. Below each is the rate of warming.

trend


The trend for the period 1900-1950 is 0.51 deg C or 0.103/decade

This trend occurred before CO2 became a rapidly increasing according to the IPCC and is near or is the Natural Variational rate.

The trend for 1951-2000 is 0.50 deg C or 0.100 deg C/decade.

This means that the two rates of warming are statistically insignificant DESPITE the rapid rise in CO2 and equal to NATURAL VARIATION..

GlobaltempChange.jpg


So by simple observation we can see the problem with the hypothesis of runaway temp caused by CO2. During the time they claim runway rise it was nothing of the sort and even given the rise in CO2 there was no discernible increase in that natural rise.

Just some facts for the record...
Silly ass, how does last years point fit? How about Feb, 2016?

NASA Confirms Earth’s Temperature Reached an Even-More-Terrifying Milestone in February

Update, March 12, 2016
: Data released Saturday from NASA confim that February 2016 was not only the most unusually warm month ever measured globally, at 1.35 degrees Celsius above the long-term average—it was more than 0.2 degrees Celsius warmer than the previously most unusually warm month ever measured: January 2016.*
so where is all of this warmth? Do you have information regarding where it was the warmest, cause in Chicago it wasn't. Again, 2012 was the last warm winter here, and in no way on fking earth was 2016 even close, so please share with us where this extreme warm came from.
 
Hoooo boy, back to the smart photons again. Oh well................
The Catch 22 is that SSDD wants scientific empirical evidence, yet when it comes to science he simply dismisses the science as being wrong. He substitutes his own screwy science.

How can you argue science with one who does not believe in the science?
 
From my point of view, man MIGHT have an impact. As of today it has yet to be quantified and as I have show above there is no empirical evidence to support it.

You've been provided a direct measurement of CO2's back radiation and you say there's no empirical evidence. You need to stop pretending that you're making any attempt whatsoever to have a discussion here and that you have any more qualifications than Crusader Frank, jc456 and the rest of your peers.

I have been shown observed, measured, quantified evidence that radiation will transfer from a warmer atmosphere to an instrument cooled to at least -80F....that is not evidence in support of the A in AGW...it is interesting to see that you apparently believe it is. There are no observed, measured data, however of energy radiating from a colder sky to an instrument at ambient temperature...and again, the 2 decade pause in any statistically significant warming while CO2 has increased on its merry way should call your beliefs into question....clearly you don't question anything if it comes form a place that is in agreement with your political views.

By the way....energy moving from a warmer atmosphere to an instrument which has been cooled to a very low temperature can hardly be called "back" radiation at all....can it? Isn't that just standard energy transfer from warm to cool just as the second law predicts....the same can be said for those rare instances where the atmosphere is warmer than the surface....just energy transfer...not "back" radiation at all.

Someone who actually gets it.. Bravo SSDD!
 
BillyBob. You quoted this graph once before and it was never ever published by NOAA, despite the fraudulant title. It came from http://i857.photobucket.com/albums/ab140/Billy_Bob_photos/GlobaltempChange.jpg. I think you or someone else Photoshopped that Photobucket photo.

Please cite a legitimate NOAA source and not something from your personal bucket of photos.
What I said was, the data used for the graph came from NOAA.. A failure to read.again...
 
Hoooo boy, back to the smart photons again. Oh well................
The Catch 22 is that SSDD wants scientific empirical evidence, yet when it comes to science he simply dismisses the science as being wrong. He substitutes his own screwy science.

How can you argue science with one who does not believe in the science?

The second law disproves your position with cold hard observed physical reactionary evidence.
 
Hoooo boy, back to the smart photons again. Oh well................
The Catch 22 is that SSDD wants scientific empirical evidence, yet when it comes to science he simply dismisses the science as being wrong. He substitutes his own screwy science.

How can you argue science with one who does not believe in the science?
well dude, when one tries to talk real science, well it's ignored. I have asked and yet still hasn't been answered, how is it there can be more warming if LWIR is down? It's a simple question and one of science. The science says you need LWIR to be absorbed and if you believe in the magic CO2 pill of back radiation, you need it to radiate back. If there is less how is it there is more? hmmmmmm?
 
My question is where is this evidence? I have been asking for decades to see some actual observed, measured, quantified, empirical evidence gathered from out here in the real, observable, measurable quantifiable world that supports the anthropogenic component of the AGW hypothesis.

And we've given it to you, over and over. You just choose to lie about that.

Stratospheric cooling. Is there a natural explanation for that? No. Hence, "A".

Increase in backradiation. Is there a natural explanation for that? No. Hence, "A".

Decrease in outgoing longwave in GHG bands. Is there a natural explanation for that? No. Hence, "A".
 
Hoooo boy, back to the smart photons again. Oh well................

Your attempt at diversion...not mine...the fact remains that cricks observed and measured radiation from the atmosphere were made by an instrument that had been cooled to a temperature lower than that of the atmosphere....one does not need a cooled instrument to measure energy coming in from the sun, why then, if according to the greenhouse hypothesis twice as much energy is coming to the earth from the atmosphere than comes from the sun must one have a cooled instrument in order to measure it....

Aside from that, the prolonged 2 decade period in which warming was statistically insignificant if it existed at all while CO2 continued to rise, calls the CO2 component of warming theory and therefore the A in AGW seriously into question,
 
My question is where is this evidence? I have been asking for decades to see some actual observed, measured, quantified, empirical evidence gathered from out here in the real, observable, measurable quantifiable world that supports the anthropogenic component of the AGW hypothesis.

And we've given it to you, over and over. You just choose to lie about that.

Stratospheric cooling. Is there a natural explanation for that? No. Hence, "A".

Increase in backradiation. Is there a natural explanation for that? No. Hence, "A".

Decrease in outgoing longwave in GHG bands. Is there a natural explanation for that? No. Hence, "A".
so, the absence of evidence mean it has to man? hahahahahahahahaahahahahhahaha, see that's the silly I can't ignore.

And you all want to tell us we don't use science. hahahahahahahahhaa, holy fk.
 
Well lets put some context to your post SSDD.. And a few facts..

Below are two rates of warming from the Hadcrut3 lower troposphere. One is from the period 1900 through 1950 and the the other is 1951 through 2000. Below each is the rate of warming.

trend


The trend for the period 1900-1950 is 0.51 deg C or 0.103/decade

This trend occurred before CO2 became a rapidly increasing according to the IPCC and is near or is the Natural Variational rate.

The trend for 1951-2000 is 0.50 deg C or 0.100 deg C/decade.

This means that the two rates of warming are statistically insignificant DESPITE the rapid rise in CO2 and equal to NATURAL VARIATION..

GlobaltempChange.jpg


So by simple observation we can see the problem with the hypothesis of runaway temp caused by CO2. During the time they claim runway rise it was nothing of the sort and even given the rise in CO2 there was no discernible increase in that natural rise.

Just some facts for the record...
Silly ass, how does last years point fit? How about Feb, 2016?

NASA Confirms Earth’s Temperature Reached an Even-More-Terrifying Milestone in February

Update, March 12, 2016
: Data released Saturday from NASA confim that February 2016 was not only the most unusually warm month ever measured globally, at 1.35 degrees Celsius above the long-term average—it was more than 0.2 degrees Celsius warmer than the previously most unusually warm month ever measured: January 2016.*

Too funny;

Hundredths of a degree are "terrifying" when the paleo records show this is not unusual or anything to be frightened of. Then you use the 38 year satellite record as proof of AGW without context.. Show me where MAN caused this warmth and how you ruled out latent heat from the recent El Niño.. Even the idiots over at SKS know that 99.5% of this pencil whipped number you claim as rise is not man caused and is natural variation.
 
Hoooo boy, back to the smart photons again. Oh well................
The Catch 22 is that SSDD wants scientific empirical evidence, yet when it comes to science he simply dismisses the science as being wrong. He substitutes his own screwy science.

How can you argue science with one who does not believe in the science?

I believe in science...I do not believe in hoaxes...we skeptics have been told that there exists a overwhelming body of observed, measured, quantified, empirical evidence in support of the A in AGW...this thread clearly proves that no such vast body of actual observed measured evidence gathered out in the real world exists and those bits that have been provided are strong evidence of something but that something is not the A in the AGW hypothesis.

As I have stated all along, there is no actual observed, measured, quantified, empirical evidence that supports the A in AGW.
 
Hoooo boy, back to the smart photons again. Oh well................

Your attempt at diversion...not mine...the fact remains that cricks observed and measured radiation from the atmosphere were made by an instrument that had been cooled to a temperature lower than that of the atmosphere....one does not need a cooled instrument to measure energy coming in from the sun, why then, if according to the greenhouse hypothesis twice as much energy is coming to the earth from the atmosphere than comes from the sun must one have a cooled instrument in order to measure it....

Aside from that, the prolonged 2 decade period in which warming was statistically insignificant if it existed at all while CO2 continued to rise, calls the CO2 component of warming theory and therefore the A in AGW seriously into question,
and agreed to by the IPCC AR5 report, BTW.
 
BillyBob. You quoted this graph once before and it was never ever published by NOAA, despite the fraudulant title. It came from http://i857.photobucket.com/albums/ab140/Billy_Bob_photos/GlobaltempChange.jpg. I think you or someone else Photoshopped that Photobucket photo.

Please cite a legitimate NOAA source and not something from your personal bucket of photos.
What I said was, the data used for the graph came from NOAA.. A failure to read.again...

Funny, they were asked to provide some of this claimed overwhelming body of observational evidence supporting the A in AGW and what they have presented is just pitiful and it seems that they are going to spend more time trying to divert from their failure by complaining about graphs which you were never asked to provide in the first place and have nothing to do with proving the A in AGW.
 
Your attempt at diversion...not mine...the fact remains that cricks observed and measured radiation from the atmosphere were made by an instrument that had been cooled to a temperature lower than that of the atmosphere....one does not need a cooled instrument to measure energy coming in from the sun, why then, if according to the greenhouse hypothesis twice as much energy is coming to the earth from the atmosphere than comes from the sun must one have a cooled instrument in order to measure it....

As we've pointed out to you before, you can buy thermal imagers right now which measure the backradiation and which don't need to be cooled.

That is, your stupid theory is now contradicted by the free market. Which sort of makes you a socialist.

And as you know your stupid crap has been debunked and you keep posting it anyways, it also makes you a liar, so there's no reason to speak with you.

Aside from that, the prolonged 2 decade period in which warming was statistically insignificant if it existed at all while CO2 continued to rise, calls the CO2 component of warming theory and therefore the A in AGW seriously into question,

No, lying about statistics won't help you either.
post a link with one of these devices.
 
My question is where is this evidence? I have been asking for decades to see some actual observed, measured, quantified, empirical evidence gathered from out here in the real, observable, measurable quantifiable world that supports the anthropogenic component of the AGW hypothesis.

And we've given it to you, over and over. You just choose to lie about that.

No you haven't hairball and this thread is hard observable evidence of that...For all the bluster of a supposed overwhelming body of evidence in support of the A in AGW, what has been provided is completely underwhelming and doesn't support the A at all...

Stratospheric cooling. Is there a natural explanation for that? No. Hence, "A".

Is CO2 emitted from internal combustion engines the only factor within the climate that can cause stratospheric cooling? Has the stratosphere never cooled before? You are offering up a vague correlation based on a shaky hypothesis...not actual observed, measured, quantified, empirical data in support of the A in AGW...but thanks for showing what passes for such evidence in your mind.

Increase in backradiation. Is there a natural explanation for that? No. Hence, "A".

If radiation is detected from the atmosphere with an instrument that is cooled to a temperature lower than that of the atmosphere is it back radiation at all? There are no observed, measured, quantified data demonstrating backradiation from the atmosphere gathered with an instrument at ambient temperature. One need not cool an instrument in order to detect, measure, and quantify energy incoming from the sun and according to AGW, more than twice as much energy comes to the surface of the earth from the atmosphere in the form of back radiation than comes from the sun...why then, would one need an instrument cooled to a temperature lower than that of the atmosphere in order to detect twice as much energy as is incoming from the sun?

Decrease in outgoing longwave in GHG bands. Is there a natural explanation for that? No. Hence, "A".

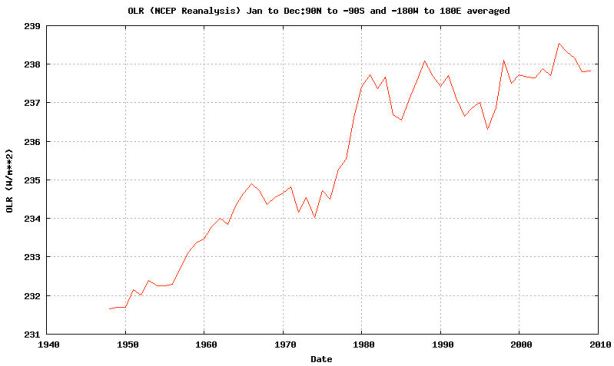
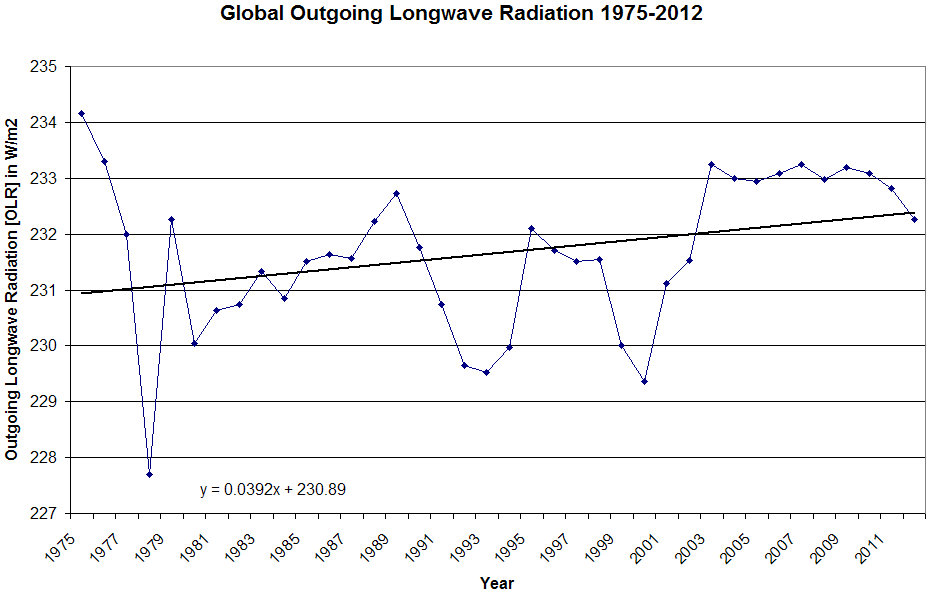
There is no decrease in OLR...in fact, it is increasing contrary to the predictions of the AGW hypothesis...yet another failure..

outgoing-longwave-radiation-1948-2009.jpg

Fullscreen%2Bcapture%2B342013%2B72040%2BPM.jpg
 
Last edited:

Forum List

Back
Top