Global Cooling in 2009

HyenaKiller

Custom User Tittie
Dec 20, 2009
60
14
6
USSA
Global Cooling in 2009

Ice+Age.jpg


2009 was another year of global cooling, which saw numerous low temperature and high snowfall records smashed. The Dutch canals froze over for the first time in 12 years, record cold came to Al Gore's home town and ironically a blizzard dumped snow on the Copenhagen convention where world leaders met to try and stop global warming. It was so cold that even the BBC was forced to ask, what happened to global warming? As Climategate would reveal, IPCC scientists had been hard at work hiding evidence of global cooling. Yet the observational evidence cannot be ignored.

"The fact is that we can't account for the lack of warming at the moment and it is a travesty that we can't."
- Kevin Trenberth, Lead Author IPCC (2001, 2007)


canadaeast.com - Record cold wind chills of -50 C recorded overnight in Saskatchewan | Jim Macdonald, THE CANADIAN PRESS - Breaking News, New Brunswick, Canada

Coldest start to the New Year for seven years - Telegraph

London colder than Antarctica - Telegraph

Poor burn books to stay warm in chilly India, 55 dead | Top News | Reuters

Cold streak sets new record

Record cold weather payouts triggered as temperature hits -11C - Times Online

Sunday was cold record-breaking cold - Food - Living - The Moose Jaw Times Herald
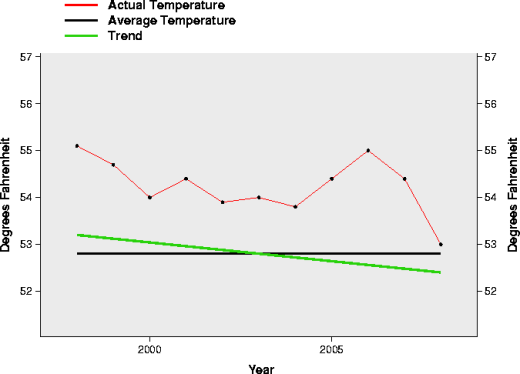
NCDC updates database for Dec08 – NCDC’s own graphic shows decadal cooling trend « Watts Up With That?

Global Warming is Really Global Cooling | Energy & Environment
 
And you are totally full of shit. 2009 will rank somewhere between the 5th warmest and 2nd warmest year on record in the last 185 years. Depending on how warm December is.

You are just another fool that cannot tell the differance between a transient weather event, and a long term trend.

All of the warmest years on record have been between 1998 and 2009. But you claim a cooling trend. What a fool you are.


November 2009 UAH Global Temperature Update +0.50 deg. C « Roy Spencer, Ph. D.

YR MON GLOBE NH SH TROPICS
2009 1 +0.304 +0.443 +0.165 -0.036
2009 2 +0.347 +0.678 +0.016 +0.051
2009 3 +0.206 +0.310 +0.103 -0.149
2009 4 +0.090 +0.124 +0.056 -0.014
2009 5 +0.045 +0.046 +0.044 -0.166
2009 6 +0.003 +0.031 -0.025 -0.003
2009 7 +0.411 +0.212 +0.610 +0.427
2009 8 +0.229 +0.282 +0.177 +0.456
2009 9 +0.422 +0.549 +0.294 +0.511
2009 10 +0.286 +0.274 +0.297 +0.326
2009 11 +0.496 +0.418 +0.575 +0.493

You are a fucking idiot. Can't you see the graphs above? You want links dipshit? MANBEAR PIG IS REAL DAMN IT!!!
 
ncdc-december-2008.png


Source: National Climatic Data Center

Damn, now aren't you the smart one. You pick 1998 as a starting point, so that in spite of the fact that ten of the years in the last eleven are the warmest years on record, you get a downward trend. Except, of course, when 2010 comes in at warmer than 1998 your silly cherry picked graph is blown to bits.

If you want to lie, choose a dumber crowd to do it in.

LIE? The only liars are the the AGW crowd. And THAT is a fact JACK...
 
And you are totally full of shit. 2009 will rank somewhere between the 5th warmest and 2nd warmest year on record in the last 185 years. Depending on how warm December is.

You are just another fool that cannot tell the differance between a transient weather event, and a long term trend.

All of the warmest years on record have been between 1998 and 2009. But you claim a cooling trend. What a fool you are.


November 2009 UAH Global Temperature Update +0.50 deg. C « Roy Spencer, Ph. D.

YR MON GLOBE NH SH TROPICS
2009 1 +0.304 +0.443 +0.165 -0.036
2009 2 +0.347 +0.678 +0.016 +0.051
2009 3 +0.206 +0.310 +0.103 -0.149
2009 4 +0.090 +0.124 +0.056 -0.014
2009 5 +0.045 +0.046 +0.044 -0.166
2009 6 +0.003 +0.031 -0.025 -0.003
2009 7 +0.411 +0.212 +0.610 +0.427
2009 8 +0.229 +0.282 +0.177 +0.456
2009 9 +0.422 +0.549 +0.294 +0.511
2009 10 +0.286 +0.274 +0.297 +0.326
2009 11 +0.496 +0.418 +0.575 +0.493

You are a fucking idiot. Can't you see the graphs above? You want links dipshit? MANBEAR PIG IS REAL DAMN IT!!!

Of course I can see your lying chart. Idiots like you apparently do not realize that all you have to do to get a chart in which the slope is up is start it at 1997, or 1999.

How dumb do you really think that the rest of us are? Look at the chart on the site that I gave you. Then come back and tell me about global cooling. Bet you are stupid enough to do just that.
 
And you are totally full of shit. 2009 will rank somewhere between the 5th warmest and 2nd warmest year on record in the last 185 years. Depending on how warm December is.

You are just another fool that cannot tell the differance between a transient weather event, and a long term trend.

All of the warmest years on record have been between 1998 and 2009. But you claim a cooling trend. What a fool you are.


November 2009 UAH Global Temperature Update +0.50 deg. C « Roy Spencer, Ph. D.

______

Ah - you are using Roy Spencer's data! Excellent!

Here are some recent observations from Dr. Spencer regarding the the idea of "man-made" global warming...


...As Dick Lindzen alluded to back in 1990, while everyone seems to understand that the greenhouse effect warms the Earth’s surface, few people are aware of the fact that weather processes greatly limit that warming. And one very real possibility is that the 1 deg. C direct warming effect of doubling our atmospheric CO2 concentration by late in this century will be mitigated by the cooling effects of weather to a value closer to 0.5 deg. C or so (about 1 deg. F.) This is much less than is being predicted by the UN’s Intergovernmental Panel on Climate Change or by NASA’s James Hansen, who believe that weather changes will amplify, rather than reduce, that warming.[/B]

...Global Warming: Natural or Manmade?
“Global warming” refers to the global-average temperature increase that has been observed over the last one hundred years or more. But to many politicians and the public, the term carries the implication that mankind is responsible for that warming. This website describes evidence from my group’s government-funded research that suggests global warming is mostly natural, and that the climate system is quite insensitive to humanity’s greenhouse gas emissions and aerosol pollution.


...The case for natural climate change I also present an analysis of the Pacific Decadal Oscillation which shows that most climate change might well be the result of….the climate system itself! Because small, chaotic fluctuations in atmospheric and oceanic circulation systems can cause small changes in global average cloudiness, this is all that is necessary to cause climate change. You don’t need the sun, or any other ‘external’ influence (although these are also possible…but for now I’ll let others work on that). It is simply what the climate system does. This is actually quite easy for meteorologists to believe, since we understand how complex weather processes are. Your local TV meteorologist is probably a closet ’skeptic’ regarding mankind’s influence on climate.

Climate change — it happens, with or without our help.


And here Dr. Spencer shows us how this month's temps are "shaping up" - they are damn COLD!!! (2009 is on the left side)


discover-amsu5-trends-screenshot1.jpg


Roy Spencer, Ph. D.
 
OK, I looked at the really idiotic graphs on your first link. Watt is a liar and a charlatan. How the hell do you get away with a dotted 'projection' line through existing data? A line in total variance with the data.

Data @ NASA GISS: GISS Surface Temperature Analysis (GISTEMP)

Geology News: Global Warming Graph and Map Information

Remote Sensing Tutorial Page 16-2

Global Warming -- Research Issues

Global Warming Stopped in 1998 — OSS Foundation

Real data from real scientists, not the charlatans that you posted.


Keep drinking the koolaid, the MAN BEAR PIG is out of the bag.

A Major Deception on Global Warming

The Hockey Stick scam that heightened global warming hysteria

Austria sees earliest snow in history, and America sees lowest temperatures in 50 years: So where did global warming go? | Mail Online
 
Thats the problem with the GLOBAL WARMING crowd. They only want to hear from THEIR sources. And they dismiss ANYONE that does not bow at the alter of AL GORE and MICHAEL the LYING DOUCHEBAG Mann.
 
Very interesting. Very interesting, indeed. Especially since the oceans were hotter July through August of 2009 than has ever been recorded before.

In hot water: World sets ocean temperature record (Update)
The average water temperature worldwide was 62.6 degrees, according to the National Climatic Data Center, the branch of the U.S. government that keeps world weather records. June was only slightly cooler, while August could set another record, scientists say. The previous record was set in July 1998 during a powerful El Nino.
.......................................................................
Not only that, but November, 2009, was the warmest November, worldwide, ever recorded in the past 185 years. Very possible that December will also be a very warm month, worldwide.

So how does that fit this particular geologist's prediction?

I will make a prediction right here. In the next five years. two of them will exceed 1998. More than likely, 2010 will be one of those years.


Geologist forecasts global cooling - 15/05/2009

Friday, 15/05/2009

An Australian geologist and author claims it's the natural cycles of the sun that change climate, not greenhouse gas emissions.

David Archibald also says the planet is actually going to cool down over the next decade.

He says the world is entering its 24th solar cycle, where the magnetic poles of the sun swap around.

Mr Archibald says the evidence is there to prove his theory that this happens every 11 years or so.

"You can see a solar signal, an 11-year solar signal even in wheat prices in England back in the 18th century," he says.

"It does affect climate. Parts of the world will be getting 2.8 degrees colder over the next 10 years."
 

Forum List

Back
Top