jon_berzerk
Platinum Member
- Mar 5, 2013
- 31,401
- 7,369
- 1,130
you should have put a **graphic content** warning label on that
to best prepare the leftards
--LOL
to best prepare the leftards
--LOL
Follow along with the video below to see how to install our site as a web app on your home screen.
Note: This feature may not be available in some browsers.
This should send the alarmists into orbit... When EMPIRICAL DATA is used, our current rate of warming if far less than the one ending in 1937... The last half of the twentieth century was not uncommon or unprecedented....
The curve shows 2 major periods of cooling since 1880. Each lasted approximately a decade (1900 to 1910, and 1942 to 1952), and reached cooling rates of about -2.0 °C per century. There is a large interval of continuous warming from 1910 to 1942 (about 32 years). This reached a maximum rate of warming of about +2.8 °C per century around 1937. 1937 is the year with the highest rate of warming since the start of the GISTEMP series in 1880

This article is sure to leave a permeate mark in the CAGW agenda showing all of their dire warnings and alramisim a LIE!
OUCH.. This is going to leave a mark!
Source
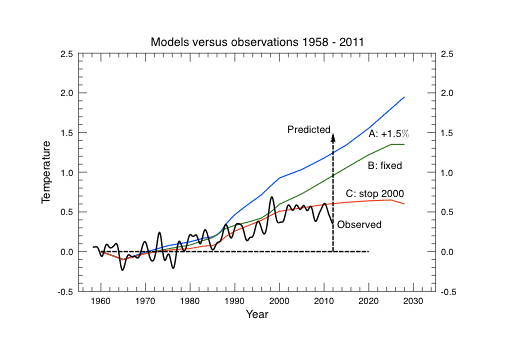
Graph suggests the globe is warming, no?
Sure.. You'd have to take an integral here and there to be math certain,, but I'll give ya that..
The argument has never been over whether it's warming -- but how much and how quickly..
If the rate is 1degC/century instead of the 5degC/century that Doc Hansen told Congress in 1988 -- we've wasted a shitload of enviro hysteria on the topic.. The actual science is ALSO about HOW MUCH of the effect is due to man as opposed to well known natural cycles..
From THAT chart -- knowing that CO2 has done nothing but INCREASE fairly linearly throughout that time period -- you'd have to conclude that CO2 ALONE is not the clear forcing function in our recent temperature record..
Most all of the doomsday scare propaganda still stems from the absurd projections (now failed) that were made decades ago... Skeptics have already prevailed...
Which BTW -- is why the GWarming propaganda is getting more and more shrill as the early predictions continue to fail.. And why remediation efforts and political schemes have failed to get traction..
If you took an eyeball estimate of the linear trend in that chart -- you'd have to conclude about 1deg/century.. Which is in fact -- where we actually are. Right at the CO2 only estimate of warming without all the GWarming magic multiplliers and hocus poci and fear mongering for political advantage..
This should send the alarmists into orbit... When EMPIRICAL DATA is used, our current rate of warming if far less than the one ending in 1937... The last half of the twentieth century was not uncommon or unprecedented....
The curve shows 2 major periods of cooling since 1880. Each lasted approximately a decade (1900 to 1910, and 1942 to 1952), and reached cooling rates of about -2.0 °C per century. There is a large interval of continuous warming from 1910 to 1942 (about 32 years). This reached a maximum rate of warming of about +2.8 °C per century around 1937. 1937 is the year with the highest rate of warming since the start of the GISTEMP series in 1880
This article is sure to leave a permeate mark in the CAGW agenda showing all of their dire warnings and alramisim a LIE!
OUCH.. This is going to leave a mark!
Source
Graph suggests the globe is warming, no?
Sure.. You'd have to take an integral here and there to be math certain,, but I'll give ya that..
The argument has never been over whether it's warming -- but how much and how quickly..
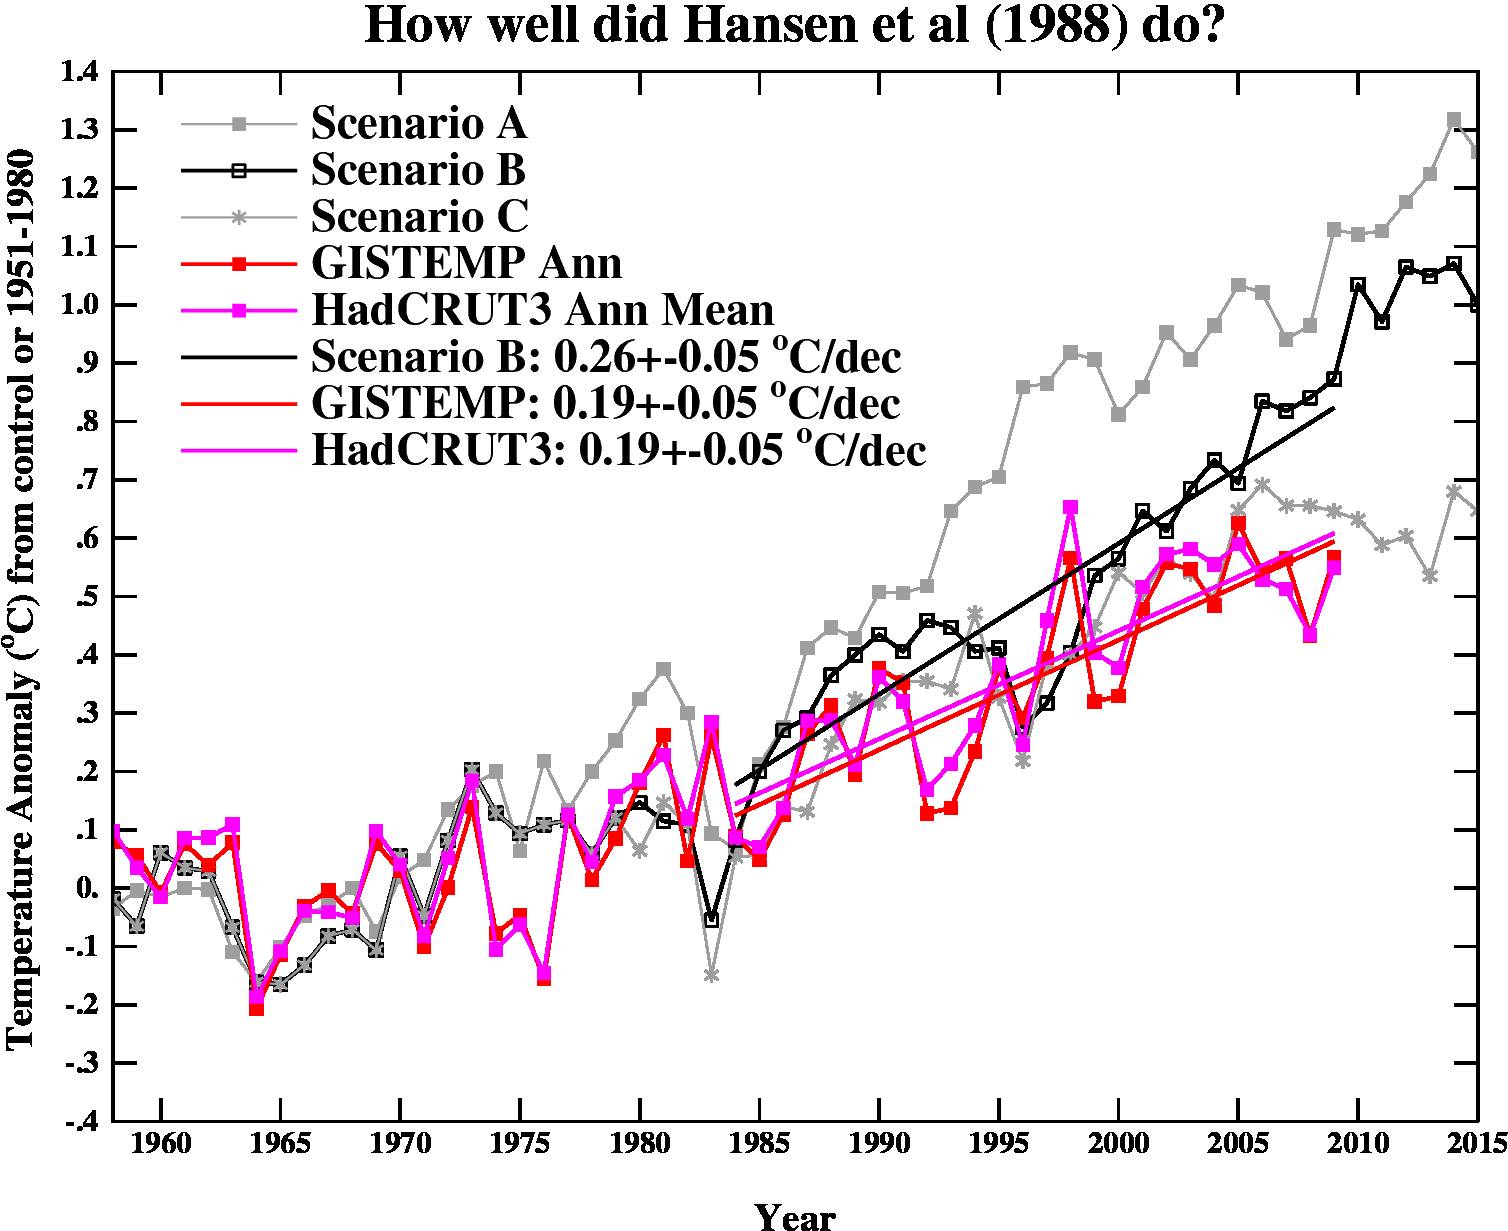
If the rate is 1degC/century instead of the 5degC/century that Doc Hansen told Congress in 1988 -- we've wasted a shitload of enviro hysteria on the topic.. The actual science is ALSO about HOW MUCH of the effect is due to man as opposed to well known natural cycles..
From THAT chart -- knowing that CO2 has done nothing but INCREASE fairly linearly throughout that time period -- you'd have to conclude that CO2 ALONE is not the clear forcing function in our recent temperature record..
Most all of the doomsday scare propaganda still stems from the absurd projections (now failed) that were made decades ago... Skeptics have already prevailed...
Which BTW -- is why the GWarming propaganda is getting more and more shrill as the early predictions continue to fail.. And why remediation efforts and political schemes have failed to get traction..
If you took an eyeball estimate of the linear trend in that chart -- you'd have to conclude about 1deg/century.. Which is in fact -- where we actually are. Right at the CO2 only estimate of warming without all the GWarming magic multiplliers and hocus poci and fear mongering for political advantage..
Wouldn't the rate of warming be increasing then, according to the chart and estimating a linear trend?
The current rate of warming is 1.6C per century. Very close to Hansen's 1988 prediction.
Can't get away with that lie... Your handlers haven't purged the evidence yet..
Hansen's band of merry activist zealots in 1988 -- just prior to the famous senate hearing was predicting 0.5degC/decade or 5 degC/century for the "A" scenario. Which was a modest 1.5% INCREASE in CO2.
And he was juicing the propaganda passed to the media behind the scenes in that Senate appearance. From the NY TIMES coverage of that Senate appearance.. The article has Hansen's name all over it..
Global Warming Has Begun, Expert Tells Senate
Global Warming Has Begun, Expert Tells Senate
Mathematical models have predicted for some years now that a buildup of carbon dioxide from the burning of fossil fuels such as coal and oil and other gases emitted by human activities into the atmosphere would cause the earth's surface to warm by trapping infrared radiation from the sun, turning the entire earth into a kind of greenhouse.
If the current pace of the buildup of these gases continues, the effect is likely to be a warming of 3 to 9 degrees Fahrenheit from the year 2025 to 2050, according to these projections. This rise in temperature is not expected to be uniform around the globe but to be greater in the higher latitudes, reaching as much as 20 degrees, and lower at the Equator.
Now where the fuck do you think the NYTimes got that "modeling" information? At the time NASA was the home to the climate modeling.. And this is the PROPAGANDA COVER that Hansen gave to the media and politicians to JUSTIFY their anti-fossil fuel campaign. The opening shot in the this long war.. It's the Fort Sumter of the Global Weirding wars..
Hansen was well quoted by 1988 as referring to coal trains as "trains of death"... THIS is the witchdoctory that built your movement. No wonder you can't confront it rationally or intelligiently..
Blantant lying about simple stuff like this is what I WANT you to do.. Because as a sack of lying shit -- you EXCEL at it..


This should send the alarmists into orbit... When EMPIRICAL DATA is used, our current rate of warming if far less than the one ending in 1937... The last half of the twentieth century was not uncommon or unprecedented....
The curve shows 2 major periods of cooling since 1880. Each lasted approximately a decade (1900 to 1910, and 1942 to 1952), and reached cooling rates of about -2.0 °C per century. There is a large interval of continuous warming from 1910 to 1942 (about 32 years). This reached a maximum rate of warming of about +2.8 °C per century around 1937. 1937 is the year with the highest rate of warming since the start of the GISTEMP series in 1880
This article is sure to leave a permeate mark in the CAGW agenda showing all of their dire warnings and alramisim a LIE!
OUCH.. This is going to leave a mark!
Source
Graph suggests the globe is warming, no?
Sure.. You'd have to take an integral here and there to be math certain,, but I'll give ya that..
The argument has never been over whether it's warming -- but how much and how quickly..
If the rate is 1degC/century instead of the 5degC/century that Doc Hansen told Congress in 1988 -- we've wasted a shitload of enviro hysteria on the topic.. The actual science is ALSO about HOW MUCH of the effect is due to man as opposed to well known natural cycles..
From THAT chart -- knowing that CO2 has done nothing but INCREASE fairly linearly throughout that time period -- you'd have to conclude that CO2 ALONE is not the clear forcing function in our recent temperature record..
Most all of the doomsday scare propaganda still stems from the absurd projections (now failed) that were made decades ago... Skeptics have already prevailed...
Which BTW -- is why the GWarming propaganda is getting more and more shrill as the early predictions continue to fail.. And why remediation efforts and political schemes have failed to get traction..
If you took an eyeball estimate of the linear trend in that chart -- you'd have to conclude about 1deg/century.. Which is in fact -- where we actually are. Right at the CO2 only estimate of warming without all the GWarming magic multiplliers and hocus poci and fear mongering for political advantage..
Wouldn't the rate of warming be increasing then, according to the chart and estimating a linear trend?
The current rate of warming is 1.6C per century. Very close to Hansen's 1988 prediction.
Can't get away with that lie... Your handlers haven't purged the evidence yet..
Hansen's band of merry activist zealots in 1988 -- just prior to the famous senate hearing was predicting 0.5degC/decade or 5 degC/century for the "A" scenario. Which was a modest 1.5% INCREASE in CO2.
And he was juicing the propaganda passed to the media behind the scenes in that Senate appearance. From the NY TIMES coverage of that Senate appearance.. The article has Hansen's name all over it..
Global Warming Has Begun, Expert Tells Senate
Global Warming Has Begun, Expert Tells Senate
Mathematical models have predicted for some years now that a buildup of carbon dioxide from the burning of fossil fuels such as coal and oil and other gases emitted by human activities into the atmosphere would cause the earth's surface to warm by trapping infrared radiation from the sun, turning the entire earth into a kind of greenhouse.
If the current pace of the buildup of these gases continues, the effect is likely to be a warming of 3 to 9 degrees Fahrenheit from the year 2025 to 2050, according to these projections. This rise in temperature is not expected to be uniform around the globe but to be greater in the higher latitudes, reaching as much as 20 degrees, and lower at the Equator.
Now where the fuck do you think the NYTimes got that "modeling" information? At the time NASA was the home to the climate modeling.. And this is the PROPAGANDA COVER that Hansen gave to the media and politicians to JUSTIFY their anti-fossil fuel campaign. The opening shot in the this long war.. It's the Fort Sumter of the Global Weirding wars..
Hansen was well quoted by 1988 as referring to coal trains as "trains of death"... THIS is the witchdoctory that built your movement. No wonder you can't confront it rationally or intelligiently..
Blantant lying about simple stuff like this is what I WANT you to do.. Because as a sack of lying shit -- you EXCEL at it..
Too Funny;
I had to go check but sure enough the 1.6 trend line was if we stopped all CO2 output.. OMG they are getting desperate! Omitting basic facts and hoping we wont check... Excellent catch sir!!!
Hansen's band of merry activist zealots in 1988 -- just prior to the famous senate hearing was predicting 0.5degC/decade or 5 degC/century for the "A" scenario. Which was a modest 1.5% INCREASE in CO2.
Blantant lying about simple stuff like this is what I WANT you to do.. Because as a sack of lying shit -- you EXCEL at it...
The only thing that stops me from going full commando on this leprechaun warmers
is I KNOW they are picking their sources from some of the most biased and twisted backwaters of the internet.
Sometimes I'm just too gentle with these victims of propaganda..
Gavin Schmidt provides a comparison between all three scenarios and actual global surface temperature changes in Figure 3.
Just like Hansen was lying to the NYTimes in 1988 about Northern Hemisphere being 20 deg warmer between 2025 and 2050 --- His replacement is now spinning those crap projections that started this mess.
Got a great debate for ya to watch between ole Gavin and some warmers.. One of the VERY FEW times any Climate scientists attempted to defend the "consensus".. Even Gavin admits that the warmers had their asses whooped in that debate. Interesting to watch. And YET --- Gavin Schmidt still managed to get a political appointment to be the chief witchdoctor at GISS..
Link. Or this can be regarded as just another lie.Just like Hansen was lying to the NYTimes in 1988 about Northern Hemisphere being 20 deg warmer between 2025 and 2050 --- His replacement is now spinning those crap projections that started this mess.
Got a great debate for ya to watch between ole Gavin and some warmers.. One of the VERY FEW times any Climate scientists attempted to defend the "consensus".. Even Gavin admits that the warmers had their asses whooped in that debate. Interesting to watch. And YET --- Gavin Schmidt still managed to get a political appointment to be the chief witchdoctor at GISS..
Just like Hansen was lying to the NYTimes in 1988 about Northern Hemisphere being 20 deg warmer between 2025 and 2050 --- His replacement is now spinning those crap projections that started this mess.
Got a great debate for ya to watch between ole Gavin and some warmers.. One of the VERY FEW times any Climate scientists attempted to defend the "consensus".. Even Gavin admits that the warmers had their asses whooped in that debate. Interesting to watch. And YET --- Gavin Schmidt still managed to get a political appointment to be the chief witchdoctor at GISS..
Where is the link to this debate?

