SSDD
Gold Member
- Nov 6, 2012
- 16,672
- 1,966
- 280
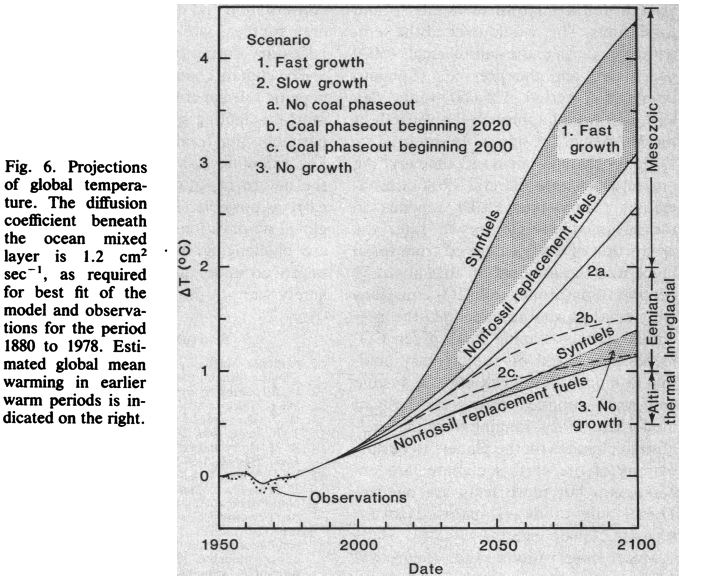
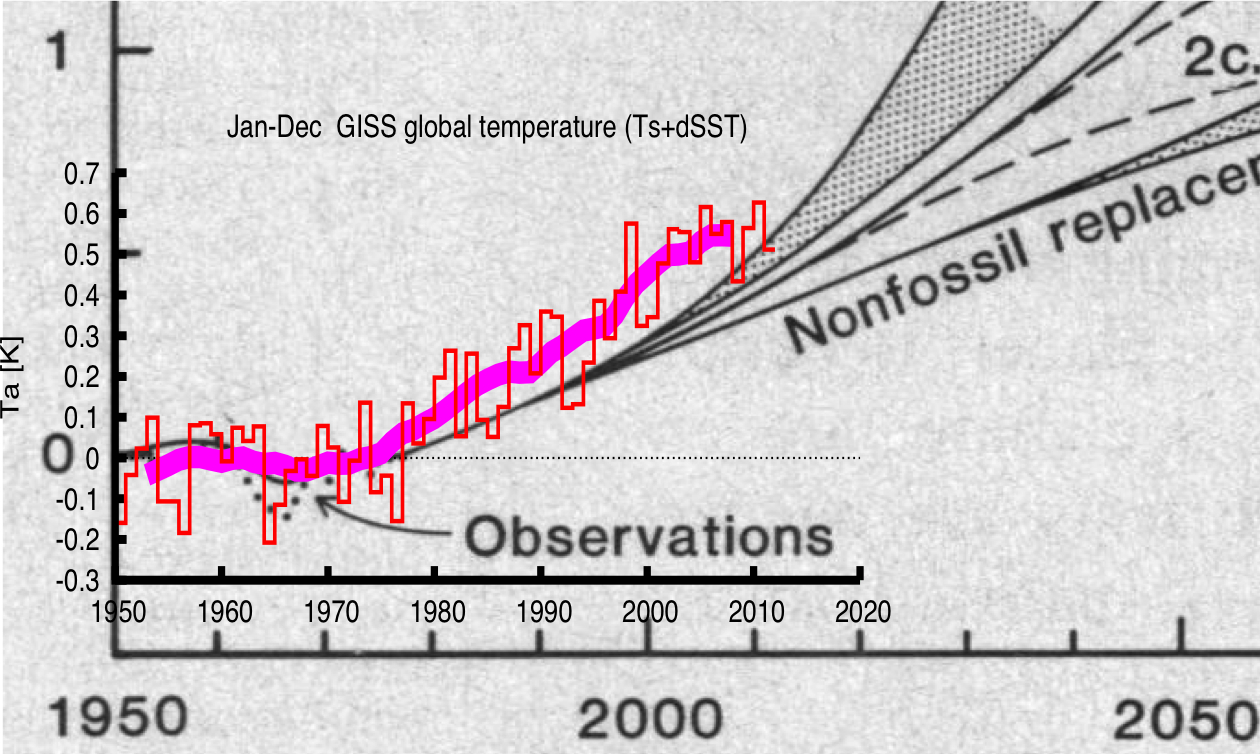
Ok, so you didn't take any science or math in school.They are not close to accurate 3 months out but they can tell you for certain what will happen a century from now.
This Afternoon
A 30 percent chance of showers after 4pm. Mostly sunny, with a high near 59. Southwest wind 5 to 10 mph, with gusts as high as 20 mph.
Tonight
Showers, mainly between 10pm and 4am, then rain and possibly a thunderstorm after 4am. Some of the storms could produce heavy rainfall. Low around 49. Southwest wind 5 to 10 mph becoming southeast in the evening. Chance of precipitation is 90%.
Thursday
Rain and possibly a thunderstorm before 10am, then showers likely, mainly between 10am and 4pm. Some of the storms could produce heavy rainfall. High near 57. West wind around 15 mph, with gusts as high as 30 mph. Chance of precipitation is 100%.
Thursday Night
Showers, mainly after 10pm. Low around 48. Southwest wind 5 to 10 mph, with gusts as high as 20 mph. Chance of precipitation is 80%.
Friday
Showers before 10am, then rain and possibly a thunderstorm after 10am. Some of the storms could produce heavy rainfall. High near 54. South wind 5 to 10 mph increasing to 10 to 15 mph in the morning. Winds could gust as high as 30 mph. Chance of precipitation is 100%.
Friday Night
Showers likely and possibly a thunderstorm. Cloudy, with a low around 47. Chance of precipitation is 70%.
Saturday
Scattered showers, mainly before 10am. Mostly cloudy, with a high near 57. Chance of precipitation is 50%.
Saturday Night
A chance of rain after 10pm. Mostly cloudy, with a low around 47.
Sunday
Rain likely, mainly after 10am. Mostly cloudy, with a high near 58.
Sunday Night
Rain. Cloudy, with a low around 49.
Monday
Rain. Cloudy, with a high near 56.
Monday Night
Showers likely. Mostly cloudy, with a low around 42.
Tuesday
A chance of showers. Mostly sunny, with a high near 59.
How DARE you. Don't you understand climate is not weather or something.
At least that's what liberals say when their predictions go awry.

Climatologists study averages over significant time periods.
Your weather forecaster doesn't have the advantage of that averaging.
So then why do the restrict their studies to such a narrow period of time...why do they not extend those "significant" periods of time back to recent periods (within the past 10,000 years) where the temperatures were warmer than the present without the aid of internal combustion engines? Why don't they freely acknowledge that the present is actually cooler than most of the past 10,000 years?