Is the correlation between CO2 and temperature based on negligent misinterpretation ?

polarbear

I eat morons
Jan 1, 2011
2,375
410
140
Canada
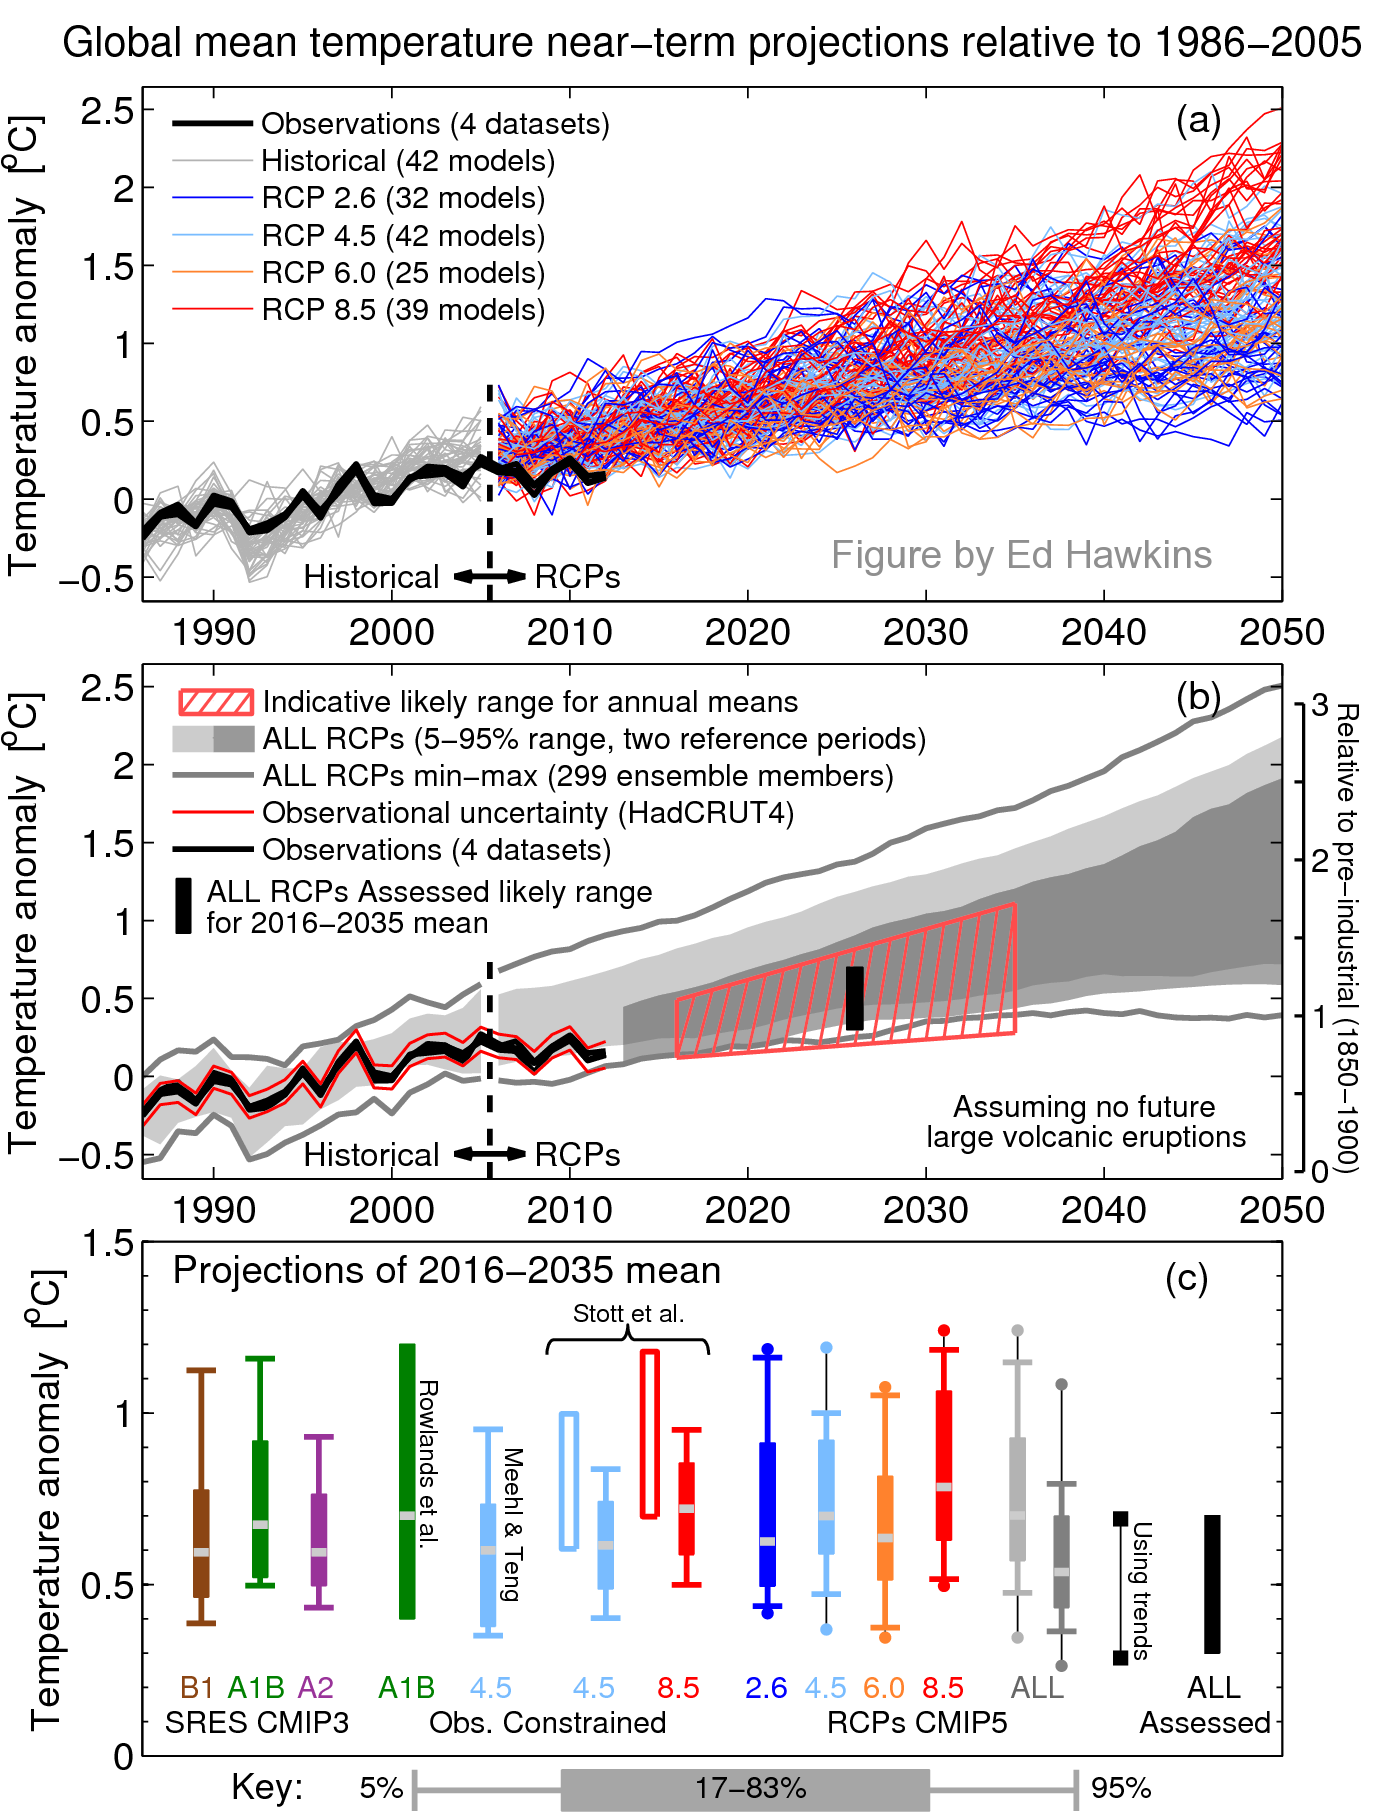
A negligent misinterpretation is when a person or a group makes misleading statements and had no reasonable grounds to believe that the statements were true but used them to induce others to enter a contract. Such is the case with the climate predictions that have been used by the IPCC to induce governments to sign very costly agreements.
A majority of the so called consensus may not be directly involved in negligent misinterpretation because they thought that the statements were based on scientific facts.
So is there a reliable correlation between temperature and CO2 ?
In order to show that there is, using empirical data and do so with a reasonable degree of confidence one has to plot CO2 concentration against temperature and not both against time in a 2 dimensional Cartesian coordinate system as shown here:
clip_image0022.jpg


This scatter plot is the proper and conventional way to analyze if a correlation exists:

clip_image006_thumb2.jpg


Correlation is classified by the Pearson correlation coefficient r .
pearson-2-small-300x109.png

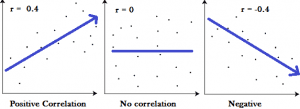
.25 or higher Very strong relationship
.15 to .25 Strong relationship
.11 to .15 Moderate relationship
.06 to .10 weak relationship
.01 to .05 No or negligible relationship
The CO2 versus temperature scatter graph shows that the only range where there is a satisfactory relationship is when the CO2 is between ~ 340 ppm (mid 1970) and just below 380 ppm (late 1990)
On either side, below and above these concentrations the correlation r is less than 0.01 especially when the CO2 is above 370 ppm as shown in this graph, which covers the time from 1999 to 2014
clip_image008_thumb1.jpg

No relationship whatsoever !
It is one thing to interpolate data and a whole different matter to extrapolate way beyond the existing data set and generate so called “data” in order to make doomsday scenario predictions for CO2 increasing to concentrations above 400 ppm:
23-ipcc-climate-models1.jpg

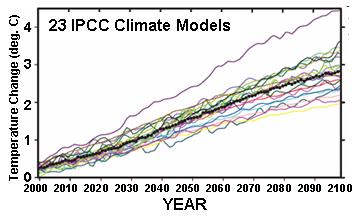
If it is not outright fraudulent to induce governments to sign agreements based on these representations buttered up with “strong confidence” and a “consensus” then it does qualify as deliberately misleading by some and certainly as a negligent misrepresentation by the cadre of consenting participants.
 
Last edited:
So all that ice is melting because it's part of a grand conspiracy?
And NASA, and 98% of the world's climate scientists are in on it? And the Chinese Government, according to the Orange Wonderboy.

 
So all that ice is melting because it's part of a grand conspiracy?
And NASA, and 98% of the world's climate scientists are in on it? And the Chinese Government, according to the Orange Wonderboy.


Have you noticed that it's governments, and bankers who are pushing this nonsense? Why do you think they are doing it? Power in the case of the governments. And money (obviously) for the bankers. Here's a homework problem for you. Look at every scheme they have to "reduce" global warming. They all consist of separating your money from you and then they do nothing else. There are no draconian laws on the books, or even in the pipeline, that actually reduces pollution.

No, you are free to pollute, you just have to pay the wealthiest of the one percent for the privilege. A thinking person would begin to wonder what they were supporting in a case like that.
 
Well, you've switched your argument from 'It's not happening' to 'People are profiteering from the fact it's happening'.
On that point, I'd have to agree, though your arguments are a little thin.
It's called 'Capitalism', old scrote, and it is what has handed us, and more particularly, our offspring, this unholy mess.
 
So all that ice is melting because it's part of a grand conspiracy?
And NASA, and 98% of the world's climate scientists are in on it? And the Chinese Government, according to the Orange Wonderboy.


The fact that the climate has warmed since the little ice age is observable...the claim that the warming is due to our CO2 emissions is fraudulent and there isn't the first piece of observed, measured, quantified, empirical evidence to support the claim that we are causing the climate to change over natural variability.
 
So all that ice is melting because it's part of a grand conspiracy?
And NASA, and 98% of the world's climate scientists are in on it? And the Chinese Government, according to the Orange Wonderboy.


Typical ! First it`s off into "melting ice" because you have no idea what qualifies as a correlation.
When libs start flapping their lips they grind the same organ over and over again. If it`s not the race-card then it`s the 98% consensus of a majority in a fringe minority group. If that fails then it`s into the conspiracy theory allegations that nobody but idiots like you pay any attention to.
"Mousterian post 16317330" ! Wow by now it must have dawned on you that none of that cuts ice any more, so it`s on to use NASA`s reputation to bolster this ridiculous line of "reasoning".
NASA sponsors many things, such as elementary schools, perhaps even the boy scouts, but sadly enough that also includes some crack-pots that have absolutely nothing to do with the kind of achievements NASA is known for. Last & not least out comes "the Orange Wonder Boy", the latest lefty-lunatic slogan.
You forgot to resort to a few more of the usual lefty slurs that wiped them off the political land scape. But that was of course the result of a Russian, Wikileaks & GOP conspiracy which employed top secret mind control.
 
Well, you've switched your argument from 'It's not happening' to 'People are profiteering from the fact it's happening'.
On that point, I'd have to agree, though your arguments are a little thin.
It's called 'Capitalism', old scrote, and it is what has handed us, and more particularly, our offspring, this unholy mess.


Wrong. My position has always been that it is happening. What my position has been for the last 15 years is man has no impact on it. None. And, there is loads of empirical data to support my claim, while there is none to support the claim that man is driving the global temps.
 
Why the two breaks? What event or process change justifies them? This looks like classic cherry picking to me. What is the correlation of the set as a whole?
"Cherry picking" would be if you were to consider only the mid section.
Why the 2 breaks? The process which justifies that is used to evaluate a Sigmoid function, or exponential functions in general. That`s problematic when you have to process a large amount of data., Exponential functions are too slow to execute and is done only when high precision is needed. If all you want is "ball park" precision then you transform the exp function into a piecewise linear function as was done with the diagram you refer to.
Transforming this kind of function into a straight line of least squares would totally ignore the nature of the original function which was based on the empirical data.
Doing so is not just a delusional exercise in order to improve the Pearson correlation value, but will ultimately result in gross errors when attempting to take the leap of faith to make predictions beyond the existing data set far into the extrapolated range.
AR5_11_25.png
 

Why the two breaks? What event or process change justifies them? This looks like classic cherry picking to me. What is the correlation of the set as a whole?

His arbitrary-breakpoint cherrypicking is the one obvious problem.

Another is that he's leaving off the last two years of very strong warming. Closer to three, given he's using a 10-month moving average. That is, he's deliberately deleting the data that disproves his theory.

Of course, Polar Bear didn't do that himself. He copied it from WUWT, without attribution. However, since he's taking credit for it, he gets the blame for leaving off the last 3 years.

A look at carbon dioxide vs. global temperature

The whole analysis is odd, cherrypicking aside. If you're doing a correlation, why correlate against a moving average, instead of the raw data? That's only introducing processing artifacts.
 
Why the 2 breaks? The process which justifies that is used to evaluate a Sigmoid function, or exponential functions in general. That`s problematic when you have to process a large amount of data., Exponential functions are too slow to execute and is done only when high precision is needed. If all you want is "ball park" precision then you transform the exp function into a piecewise linear function as was done with the diagram you refer to.
Transforming this kind of function into a straight line of least squares would totally ignore the nature of the original function which was based on the empirical data.
Doing so is not just a delusional exercise in order to improve the Pearson correlation value, but will ultimately result in gross errors when attempting to take the leap of faith to make predictions beyond the existing data set far into the extrapolated range.

Nobody is babbling about exponential functions except you. They have jack to do with anything here, including the breakpoint cherrypicking. That cherrypicking was done entirely by the eyeball of Anthony Watts.

You seem to have wandered off into a totally unrelated topic, in the hopes that your jargon would baffle people and cause them them forget about the cherrypicking problem.
 
[At Penn State, the nexus of the climate fraud. I hate to break it to ya but that is not compelling to a thinking person.

I hate to break it to you, but given that all you can do now is scream "fraud!", you're not considered to be a thinking person by anyone. You're considered to be a mindless cultist.

Oh, here's some of that evidence for the human-caused warming that you say doesn't exist. Check the paper, and the very long list of references attached to it.

Yes, we know, you'll either scream "fraud!" or "it's just a model!". You're predictable that way. And you'll do that before you even look at it. If the evidence says you're wrong, you have to auto-deny it, which means you now have to auto-deny all of the evidence.

On the causal structure between CO2 and global temperature : Scientific Reports
 
Last edited:

Why the two breaks? What event or process change justifies them? This looks like classic cherry picking to me. What is the correlation of the set as a whole?

"Cherry picking" would be if you were to consider only the mid section.

Cherry picking would be if you were to consider any unrepresentative subset with the aim of obtaining a desired result. I asked for the correlation of the entire set.

Why the 2 breaks? The process which justifies that is used to evaluate a Sigmoid function, or exponential functions in general.

The process which justifies the 2 breaks is used to evaluate a Sigmoid function? Your sentence is gibberish. There is absolutely NO reason to assume that the t vs CO2 function is a sigmoid and to justify breaking it as you have would require it be a hard or stepwise sigmoid, which it most certainly is not.

That`s problematic when you have to process a large amount of data.

Large amount of data? The dataset you put up here could be handled by my pocket calculator.

Exponential functions are too slow to execute and is done only when high precision is needed. If all you want is "ball park" precision then you transform the exp function into a piecewise linear function as was done with the diagram you refer to.

Bullshit. You were never looking for anything BUT a linear fit. You broke it to cherry pick the results, plain as day. The linear fit is simple as pie and thus there was no need to break the set into three sections. Except that produced the results you (or Anthony Watts, I suppose) were after.

Transforming this kind of function into a straight line of least squares would totally ignore the nature of the original function which was based on the empirical data.

You were looking to determine correlation. If you assume a specific functional relationship BEFORE you've determined correlation, your results are bullshit.

Doing so is not just a delusional exercise in order to improve the Pearson correlation value, but will ultimately result in gross errors when attempting to take the leap of faith to make predictions beyond the existing data set far into the extrapolated range.

This entire post of yours is just a pathetic attempt to "baffle 'em with your bulllshit". This is complete crap. The correlation between CO2 and temperature is high.
 
Panic in the hen house ?
How_to_Lie_with_Statistics.jpg

It`s been a standard text book since the 60`s for statistics college students and an unsurpassed best-seller in that field. I wonder why.
Is it (1)because people don`t like to be fooled, or (2) is it an advantage knowing how to fool people?
I would say that depends on who employs them after they graduated.
Mike the main Man and James, the other data Cook definitely consider (2) as an asset as we know from Mike`s emails and Cook posing as a theoretical physicist (Lubos Motl), using his name, agreeing with everything Cook said.
 
Last edited:
So all that ice is melting because it's part of a grand conspiracy?
And NASA, and 98% of the world's climate scientists are in on it? And the Chinese Government, according to the Orange Wonderboy.


Have you noticed that it's governments, and bankers who are pushing this nonsense? Why do you think they are doing it? Power in the case of the governments. And money (obviously) for the bankers. Here's a homework problem for you. Look at every scheme they have to "reduce" global warming. They all consist of separating your money from you and then they do nothing else. There are no draconian laws on the books, or even in the pipeline, that actually reduces pollution.

No, you are free to pollute, you just have to pay the wealthiest of the one percent for the privilege. A thinking person would begin to wonder what they were supporting in a case like that.


Reminds me of the dark ages when indulgences were sold for sinning...
 

Why the two breaks? What event or process change justifies them? This looks like classic cherry picking to me. What is the correlation of the set as a whole?

"Cherry picking" would be if you were to consider only the mid section.

Cherry picking would be if you were to consider any unrepresentative subset with the aim of obtaining a desired result. I asked for the correlation of the entire set.

Why the 2 breaks? The process which justifies that is used to evaluate a Sigmoid function, or exponential functions in general.

The process which justifies the 2 breaks is used to evaluate a Sigmoid function? Your sentence is gibberish. There is absolutely NO reason to assume that the t vs CO2 function is a sigmoid and to justify breaking it as you have would require it be a hard or stepwise sigmoid, which it most certainly is not.

That`s problematic when you have to process a large amount of data.

Large amount of data? The dataset you put up here could be handled by my pocket calculator.

Exponential functions are too slow to execute and is done only when high precision is needed. If all you want is "ball park" precision then you transform the exp function into a piecewise linear function as was done with the diagram you refer to.

Bullshit. You were never looking for anything BUT a linear fit. You broke it to cherry pick the results, plain as day. The linear fit is simple as pie and thus there was no need to break the set into three sections. Except that produced the results you (or Anthony Watts, I suppose) were after.

Transforming this kind of function into a straight line of least squares would totally ignore the nature of the original function which was based on the empirical data.

You were looking to determine correlation. If you assume a specific functional relationship BEFORE you've determined correlation, your results are bullshit.

Doing so is not just a delusional exercise in order to improve the Pearson correlation value, but will ultimately result in gross errors when attempting to take the leap of faith to make predictions beyond the existing data set far into the extrapolated range.

This entire post of yours is just a pathetic attempt to "baffle 'em with your bulllshit". This is complete crap. The correlation between CO2 and temperature is high.
You really are ignorant of statistics... who would of thunk it... Break points are used to get coefficients and PRECISION...
 

Forum List

Back
Top