Climate Sensitivities Exaggerated?

IanC

Gold Member
Sep 22, 2009
11,061
1,344
245
I have mentioned climate sensitivities in a few threads in the past. with the leak of SOD of AR5, it has been brought to the forefront again.

Ridley's WSJ article-
Matt Ridley: Cooling Down the Fears of Climate Change - WSJ.com

Mr. Lewis tells me that the latest observational estimates of the effect of aerosols (such as sulfurous particles from coal smoke) find that they have much less cooling effect than thought when the last IPCC report was written. The rate at which the ocean is absorbing greenhouse-gas-induced warming is also now known to be fairly modest. In other words, the two excuses used to explain away the slow, mild warming we have actually experienced—culminating in a standstill in which global temperatures are no higher than they were 16 years ago—no longer work.

In short: We can now estimate, based on observations, how sensitive the temperature is to carbon dioxide. We do not need to rely heavily on unproven models. Comparing the trend in global temperature over the past 100-150 years with the change in "radiative forcing" (heating or cooling power) from carbon dioxide, aerosols and other sources, minus ocean heat uptake, can now give a good estimate of climate sensitivity.

The conclusion—taking the best observational estimates of the change in decadal-average global temperature between 1871-80 and 2002-11, and of the corresponding changes in forcing and ocean heat uptake—is this: A doubling of CO2 will lead to a warming of 1.6°-1.7°C (2.9°-3.1°F).

This is much lower than the IPCC's current best estimate, 3°C (5.4°F).

if you are actually interested in the details-

Why doesn’t the AR5 SOD’s climate sensitivity range reflect its new aerosol estimates? | Watts Up With That?

There has been much discussion on climate blogs of the leaked IPCC AR5 Working Group 1 Second Order Draft (SOD). Now that the SOD is freely available, I can refer to the contents of the leaked documents without breaching confidentiality restrictions.

I consider the most significant – but largely overlooked – revelation to be the substantial reduction since AR4 in estimates of aerosol forcing and uncertainty therein. This reduction has major implications for equilibrium climate sensitivity (ECS). ECS can be estimated using a heat balance approach – comparing the change in global temperature between two periods with the corresponding change in forcing, net of the change in global radiative imbalance. That imbalance is very largely represented by ocean heat uptake (OHU).

Since the time of AR4, neither global mean temperature nor OHU have increased, while the IPCC’s own estimate of the post-1750 change in forcing net of OHU has increased by over 60%. In these circumstances, it is extraordinary that the IPCC can leave its central estimate and ‘likely’ range for ECS unchanged.


I focused on this point in my review comments on the SOD. I showed that using the best observational estimates of forcing given in the SOD, and the most recent observational OHU estimates, a heat balance approach estimates ECS to be 1.6–1.7°C – well below the ‘likely’ range of 2‑4.5°C that the SOD claims (in Section 10.8.2.5) is supported by the observational evidence, and little more than half the best estimate of circa 3°C it gives.


doesnt this take the 'catastrophic' out of CAGW? at the very least it gives us much more time to realistically improve technology to reduce CO2 emissions.
 
Ahh yes the new canard of "extreme weather". Sufficiently vague to apply to whatever weather actually occurs...that way the fraudsters are allways safe. On the other hand ask them to come up with some measurable metric and they run and hide. Typical pseudo-scientific BS.
 
It's so dry the bullfrogs is knockin' onna door, wantin' a glass o' water...
:confused:
How Dry We Are: Current Drought Reminiscent of Dust Bowl Days
January 10, 2013 – Almost 62 percent (61.8%) of the continental United States experienced drought in July 2012, making it the largest drought-affected area since the end of the “Dust Bowl" era in December 1939, when 62.1 percent of the U.S. was drought-stricken, the USDA said.
According to the Palmer Drought Index – which covers 113 years and is used for historical comparison purposes -- the worst drought ever recorded was in July 1934, when 79.9 percent of the continental U.S. was affected. The U.S. Department of Agriculture, since 1999, has used a new Drought Monitor to determine the extent of agricultural drought. As of Jan. 1, the Drought Monitor showed that 61.09 percent of the continental U.S. was experiencing drought – down from the September 2012 peak of 65.45 percent. Despite the slight decline in overall U.S. drought coverage, the central portion of the nation experiencing the worst drought category – D4, or exceptional drought – has been slowly rising. Exceptional drought covered 6.75 percent of the nation on January 1, the greatest coverage since November 2011. (See map)

drought_0.jpg


In the past week, there has been “above-normal precipitation” in the southeastern U.S., but drought conditions expanded in southwestern and central areas that didn’t get any rain. “The cumulative impact of precipitation during this week and previous weeks resulted in contraction of drought areas in the West, South, and East,” according to the National Drought Summary for Jan 1, 2013. "But drought expanded in those areas which missed out on the beneficial precipitation.” The Associated Press reported on Jan. 2 that climatologists predict it will take as much as 8 feet or more of snow during the winter months to restore farmland soil to pre-drought conditions.

On Wednesday, Agriculture Secretary Tom Vilsack designated 597 counties in 14 states as primary natural disaster areas because of drought and heat, making all qualified farm operators in the areas eligible for low-interest emergency loans. These are the first disaster designations made by the U.S. Department of Agriculture in 2013. In 2012, USDA designated 2,245 counties in 39 states as disaster areas due to drought, or 71 percent of the United States.

At the height of the 2012 drought, USDA announced a series of actions to help to farmers, ranchers and businesses impacted by the 2012 drought, including lowering the interest rate for emergency loans, working with crop insurance companies to provide flexibility to farmers, and expanding the use of set-aside conservation acreage for haying and grazing. Those same actions continue to bring relief to producers ahead of the 2013 planting season, USDA said on Wednesday.

Source
 
Ahh yes the new canard of "extreme weather". Sufficiently vague to apply to whatever weather actually occurs...that way the fraudsters are allways safe. On the other hand ask them to come up with some measurable metric and they run and hide. Typical pseudo-scientific BS.

An obviously necessary component of the unfalsifiable hypothesis.
 
I have mentioned climate sensitivities in a few threads in the past. with the leak of SOD of AR5, it has been brought to the forefront again.

Ridley's WSJ article-
Matt Ridley: Cooling Down the Fears of Climate Change - WSJ.com

Mr. Lewis tells me that the latest observational estimates of the effect of aerosols (such as sulfurous particles from coal smoke) find that they have much less cooling effect than thought when the last IPCC report was written. The rate at which the ocean is absorbing greenhouse-gas-induced warming is also now known to be fairly modest. In other words, the two excuses used to explain away the slow, mild warming we have actually experienced—culminating in a standstill in which global temperatures are no higher than they were 16 years ago—no longer work.

In short: We can now estimate, based on observations, how sensitive the temperature is to carbon dioxide. We do not need to rely heavily on unproven models. Comparing the trend in global temperature over the past 100-150 years with the change in "radiative forcing" (heating or cooling power) from carbon dioxide, aerosols and other sources, minus ocean heat uptake, can now give a good estimate of climate sensitivity.

The conclusion—taking the best observational estimates of the change in decadal-average global temperature between 1871-80 and 2002-11, and of the corresponding changes in forcing and ocean heat uptake—is this: A doubling of CO2 will lead to a warming of 1.6°-1.7°C (2.9°-3.1°F).

This is much lower than the IPCC's current best estimate, 3°C (5.4°F).

if you are actually interested in the details-

Why doesn’t the AR5 SOD’s climate sensitivity range reflect its new aerosol estimates? | Watts Up With That?

There has been much discussion on climate blogs of the leaked IPCC AR5 Working Group 1 Second Order Draft (SOD). Now that the SOD is freely available, I can refer to the contents of the leaked documents without breaching confidentiality restrictions.

I consider the most significant – but largely overlooked – revelation to be the substantial reduction since AR4 in estimates of aerosol forcing and uncertainty therein. This reduction has major implications for equilibrium climate sensitivity (ECS). ECS can be estimated using a heat balance approach – comparing the change in global temperature between two periods with the corresponding change in forcing, net of the change in global radiative imbalance. That imbalance is very largely represented by ocean heat uptake (OHU).

Since the time of AR4, neither global mean temperature nor OHU have increased, while the IPCC’s own estimate of the post-1750 change in forcing net of OHU has increased by over 60%. In these circumstances, it is extraordinary that the IPCC can leave its central estimate and ‘likely’ range for ECS unchanged.


I focused on this point in my review comments on the SOD. I showed that using the best observational estimates of forcing given in the SOD, and the most recent observational OHU estimates, a heat balance approach estimates ECS to be 1.6–1.7°C – well below the ‘likely’ range of 2‑4.5°C that the SOD claims (in Section 10.8.2.5) is supported by the observational evidence, and little more than half the best estimate of circa 3°C it gives.


doesnt this take the 'catastrophic' out of CAGW? at the very least it gives us much more time to realistically improve technology to reduce CO2 emissions.

Does a planet have to have a climate sensitivity that is constant? Who made that rule?
 
Dubya may be on to something! if climate science and the IPCC dont have to even attempt to justify their predictions with actual numbers then it can always be worse than expected!!!

just like global warming became climate change, then climate disruption, then extreme weather. and with each new label there was a definition that was more vague, and predictions that encompassed every outcome.
 
I have mentioned climate sensitivities in a few threads in the past. with the leak of SOD of AR5, it has been brought to the forefront again.

Ridley's WSJ article-
Matt Ridley: Cooling Down the Fears of Climate Change - WSJ.com

Mr. Lewis tells me that the latest observational estimates of the effect of aerosols (such as sulfurous particles from coal smoke) find that they have much less cooling effect than thought when the last IPCC report was written. The rate at which the ocean is absorbing greenhouse-gas-induced warming is also now known to be fairly modest. In other words, the two excuses used to explain away the slow, mild warming we have actually experienced—culminating in a standstill in which global temperatures are no higher than they were 16 years ago—no longer work.

In short: We can now estimate, based on observations, how sensitive the temperature is to carbon dioxide. We do not need to rely heavily on unproven models. Comparing the trend in global temperature over the past 100-150 years with the change in "radiative forcing" (heating or cooling power) from carbon dioxide, aerosols and other sources, minus ocean heat uptake, can now give a good estimate of climate sensitivity.

The conclusion—taking the best observational estimates of the change in decadal-average global temperature between 1871-80 and 2002-11, and of the corresponding changes in forcing and ocean heat uptake—is this: A doubling of CO2 will lead to a warming of 1.6°-1.7°C (2.9°-3.1°F).

This is much lower than the IPCC's current best estimate, 3°C (5.4°F).

if you are actually interested in the details-

Why doesn’t the AR5 SOD’s climate sensitivity range reflect its new aerosol estimates? | Watts Up With That?

There has been much discussion on climate blogs of the leaked IPCC AR5 Working Group 1 Second Order Draft (SOD). Now that the SOD is freely available, I can refer to the contents of the leaked documents without breaching confidentiality restrictions.

I consider the most significant – but largely overlooked – revelation to be the substantial reduction since AR4 in estimates of aerosol forcing and uncertainty therein. This reduction has major implications for equilibrium climate sensitivity (ECS). ECS can be estimated using a heat balance approach – comparing the change in global temperature between two periods with the corresponding change in forcing, net of the change in global radiative imbalance. That imbalance is very largely represented by ocean heat uptake (OHU).

Since the time of AR4, neither global mean temperature nor OHU have increased, while the IPCC’s own estimate of the post-1750 change in forcing net of OHU has increased by over 60%. In these circumstances, it is extraordinary that the IPCC can leave its central estimate and ‘likely’ range for ECS unchanged.


I focused on this point in my review comments on the SOD. I showed that using the best observational estimates of forcing given in the SOD, and the most recent observational OHU estimates, a heat balance approach estimates ECS to be 1.6–1.7°C – well below the ‘likely’ range of 2‑4.5°C that the SOD claims (in Section 10.8.2.5) is supported by the observational evidence, and little more than half the best estimate of circa 3°C it gives.


doesnt this take the 'catastrophic' out of CAGW? at the very least it gives us much more time to realistically improve technology to reduce CO2 emissions.

Does a planet have to have a climate sensitivity that is constant? Who made that rule?


Geee I don't know. Are the Laws of Physics unchanging?
 
Dubya may be on to something! if climate science and the IPCC dont have to even attempt to justify their predictions with actual numbers then it can always be worse than expected!!!

just like global warming became climate change, then climate disruption, then extreme weather. and with each new label there was a definition that was more vague, and predictions that encompassed every outcome.


Well, that is the fundamental MO of the charlatan. They still havn't addressed the fact that known charlatan Sylvia Brown, has a better prediction rate than they do!:lol::lol:
 
Dubya may be on to something! if climate science and the IPCC dont have to even attempt to justify their predictions with actual numbers then it can always be worse than expected!!!

just like global warming became climate change, then climate disruption, then extreme weather. and with each new label there was a definition that was more vague, and predictions that encompassed every outcome.

We can't lose that amount of snow cover in June or that amout of sea ice and not screw up this world.

I expect major changes now and within three years. I don't think we have the opportunity to just put this thing off on future generations.

Maybe, I'm wrong and it will be later. I'm not worried about my own ass, I'll survive to the day I die.
 
We can't lose that amount of snow cover in June or that amout of sea ice and not screw up this world.

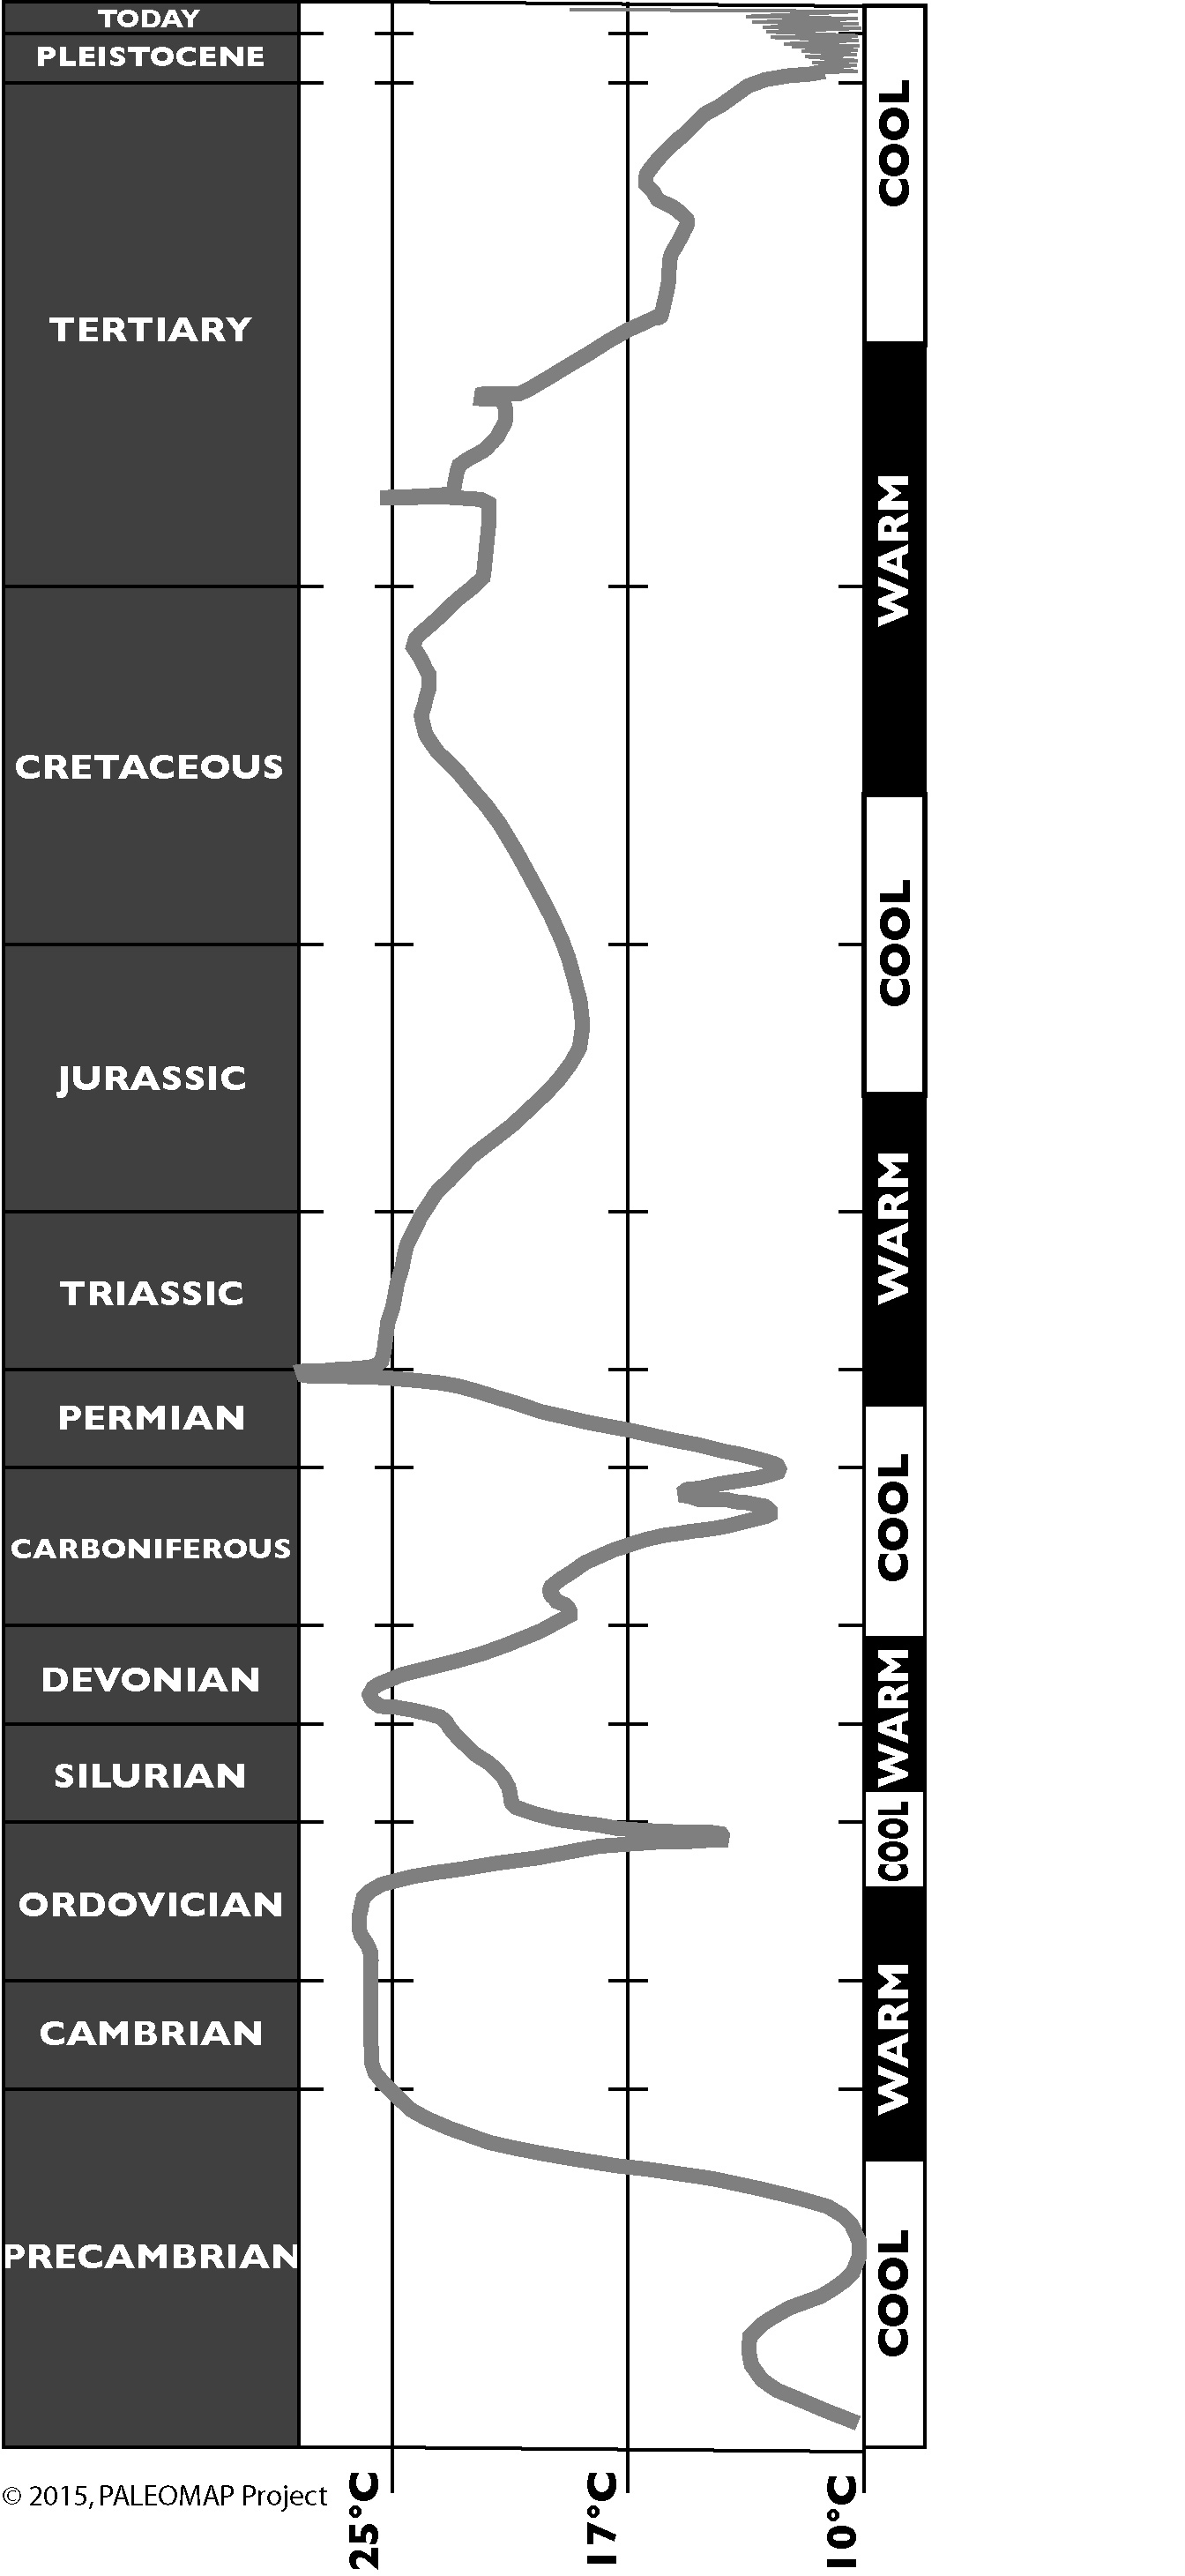
This world has spent most of its history without snow cover....anywhere. Here dubya, have a look at the temperature history of the earth....

http://scotese.com/images/globaltemp.jpg
globaltemp.jpg


Looking at that graph, tell me, if you can, about what percentage of the earth's history you believe there has been ice cover on the earth?

I expect major changes now and within three years. I don't think we have the opportunity to just put this thing off on future generations.

We have been hearing that same song and dance for decades now. Look back at the graph dubya...change is coming and we are just along for the ride. Like all life throughout the history of the earth....we adapt or we die.

The world had a circum-equatorial current from the Cretaceous period until our modern Ice Ages started around 3 million years ago, when North and South America connected.

It's really brilliant to go back hundreds of millions of years and pretend an entirely different world is the same as today! What part of having an entirely different ocean current circulation was too hard to understand? This Earth is definitely very sensitive to Milankovitch Cycles, but I don't see evidence in the past that it was. Do you think having major ocean cooling could have changed it?

Don't you have the sense to know the temperatures of the Earth in the past are in a wide range and the same applies to CO2?
 
The world had a circum-equatorial current from the Cretaceous period until our modern Ice Ages started around 3 million years ago, when North and South America connected.

I have given you evidence from one of your own trusted sources that states pretty clearly that during the Pliestocene epoch, 5 million years ago, north and south america had already closed and the temperatures were at least 11 degrees warmer than today. Ocean currents aren't the answer for why the ice age started or why the long trend went from cold to warm.

It's really brilliant to go back hundreds of millions of years and pretend an entirely different world is the same as today!

It isn't hundreds of billions of years dubya.. your lack of education is showing again. 5 million dubya...Pliestocene epoch...at least 11 degrees warmer than present in the arctic...north and south america had already connected...get a grip dubya.

Don't you have the sense to know the temperatures of the Earth in the past are in a wide range and the same applies to CO2?

What I know is that there have been periods in which the atmospheric CO2 has exceeded 6000 ppm with no run away warming...there have been periods in which atmospheric CO2 exceeded 5000 ppm at the onset of ice ages....what I can tell from the past climate, and the present is that CO2 doesn't even rise to the level of a bit player in the control of the climate. CO2 is a follower, not a leader and all of the hard evidence we have tells us exactly that.

The closure history of the Panama Isthmus: Evidence from isotopes and fossils to models and molecules | Daniela Schmidt - Academia.edu

A significant sea-level lowstand period starting at 4.6 and lastinguntil 3.1 Ma (Haq
et al. 1987) enhanced the shal-lowing of the Isthmus. Brief reversals of theisotope differential are explained by either shortbreaching of the Pacific waters into the Caribbeanacross the still-submerged sill (Haug et al. 2001)or by short-lasting re-openings at 3.8 and 3.4–3.3Ma (Fig. 5) as indicated by reduced ventilationand hence preservation (Haug & Tiedmann)

Yes, there have been times when the CO2 level was much higher than today. And the sun was dimmer. There have been times when the CO2 was drawn down by the weathering of the ancient Appalachian Mountains, and we had a snowball Earth. And there have been times when there were very rapid changes in the GHG levels in the atmosphere, and there were extinction events.

Methane catastrophe
 
A significant sea-level lowstand period starting at 4.6 and lastinguntil 3.1 Ma (Haq
et al. 1987) enhanced the shal-lowing of the Isthmus. Brief reversals of theisotope differential are explained by either shortbreaching of the Pacific waters into the Caribbeanacross the still-submerged sill (Haug et al. 2001)or by short-lasting re-openings at 3.8 and 3.4–3.3Ma (Fig. 5) as indicated by reduced ventilationand hence preservation (Haug & Tiedmann)


This is what the world looked like during the Miocene...roughly 14 million years ago. Are you going to tell me that a major ocean current ran through the shallow sea that your own paper acknowledges was present between north and south america? That current that you believe so strongly in had long since disappeared.

050.jpg


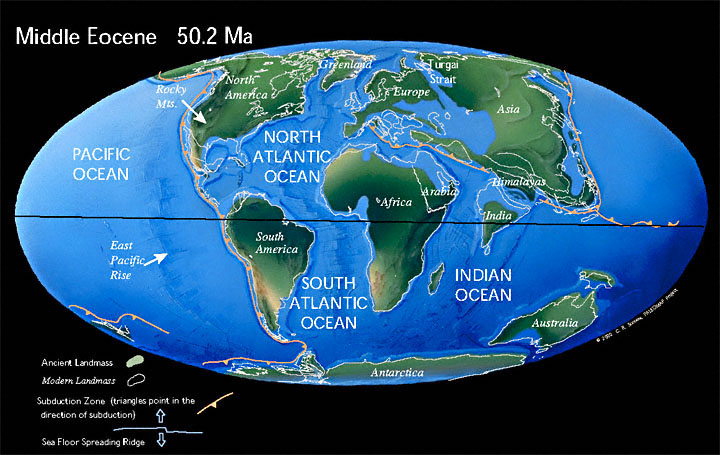
That current wouldn't have been present 50 million years ago during the Eocene:

http://scotese.com/images/050.jpg

And it is doubtful that it was all that at the time of the KT exticnction 66 million years ago. That whole region was not very deep which we all know is a requirement for important ocean currents.


Yes, there have been times when the CO2 level was much higher than today. And the sun was dimmer.


I don't guess you know that that troubling dim sun paradox disappears as soon as you stop wrongly assuming that CO2 drives the climate.
 
Last edited:
A significant sea-level lowstand period starting at 4.6 and lastinguntil 3.1 Ma (Haq
et al. 1987) enhanced the shal-lowing of the Isthmus. Brief reversals of theisotope differential are explained by either shortbreaching of the Pacific waters into the Caribbeanacross the still-submerged sill (Haug et al. 2001)or by short-lasting re-openings at 3.8 and 3.4–3.3Ma (Fig. 5) as indicated by reduced ventilationand hence preservation (Haug & Tiedmann)


This is what the world looked like during the Miocene...roughly 14 million years ago. Are you going to tell me that a major ocean current ran through the shallow sea that your own paper acknowledges was present between north and south america? That current that you believe so strongly in had long since disappeared.

050.jpg


That current wouldn't have been present 50 million years ago during the Eocene:

http://scotese.com/images/050.jpg

And it is doubtful that it was all that at the time of the KT exticnction 66 million years ago. That whole region was not very deep which we all know is a requirement for important ocean currents.


Yes, there have been times when the CO2 level was much higher than today. And the sun was dimmer.


I don't guess you know that that troubling dim sun paradox disappears as soon as you stop wrongly assuming that CO2 drives the climate.


What an idiot!

Oceans continued to be relatively warm during the Pliocene, though they continued cooling. The Arctic ice cap formed, drying the climate and increasing cool shallow currents in the North Atlantic. Deep cold currents flowed from the Antarctic.

The formation of the Isthmus of Panama about 3.5 million years ago cut off the final remnant of what was once essentially a circum-equatorial current that had existed since the Cretaceous and the early Cenozoic. This may have contributed to further cooling of the oceans worldwide.

The Pliocene seas were alive with sea cows, seals and sea lions.

Source: Pliocene - Wikipedia, the free encyclopedia

Try reading for a change!
 
Key word there dubya..."FINAL REMNANT". Meaning that it had been a very long time since the current was a major current. You don't seem to understand that as you go further back in time, the space between north and south america gets less and less, not further and further.

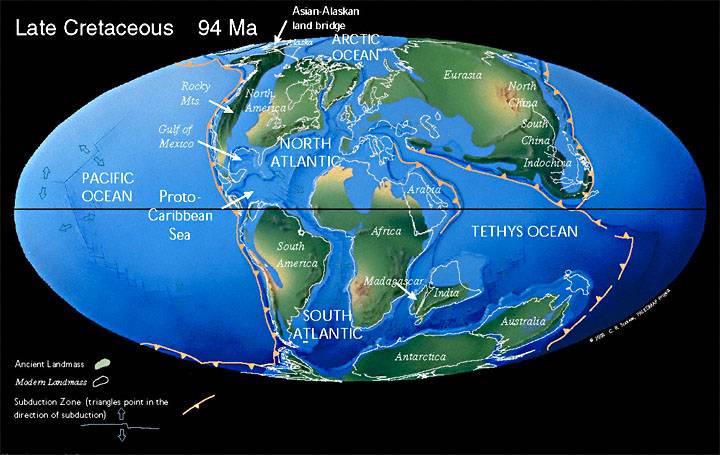
Here is what the land masses looked like during the Cretaceous...Show the that claimed circum equatorial current.

094.jpg


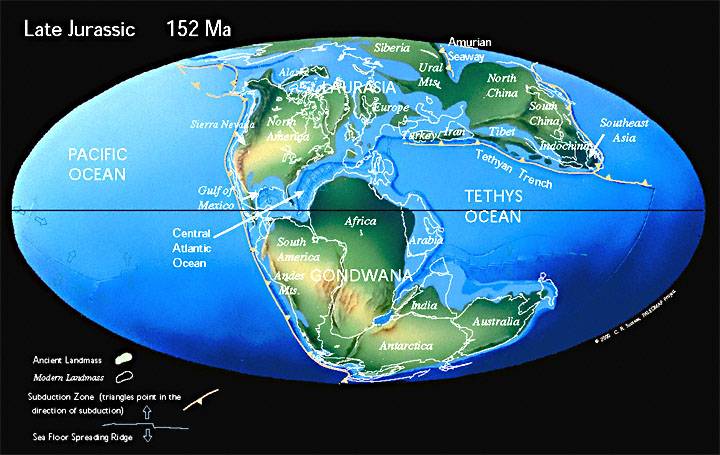
Here is what the land masses looked like during the late Jurassic. See any possibility of a circum equatorial current there?

152.jpg


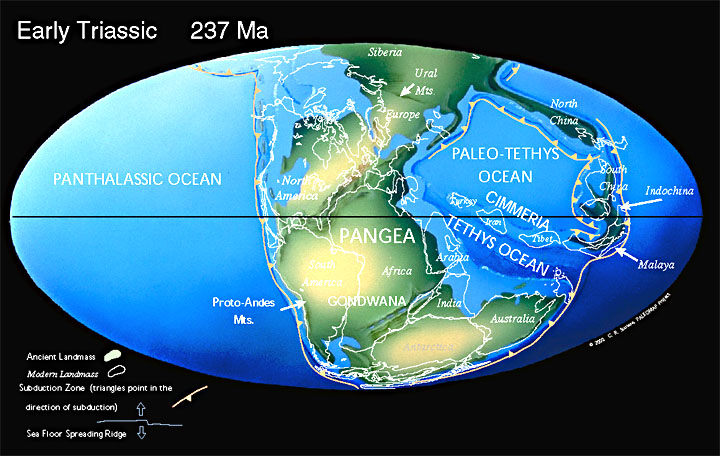
Here is the early Triassic...see any possibility of a circum equatorial current there?

237.jpg


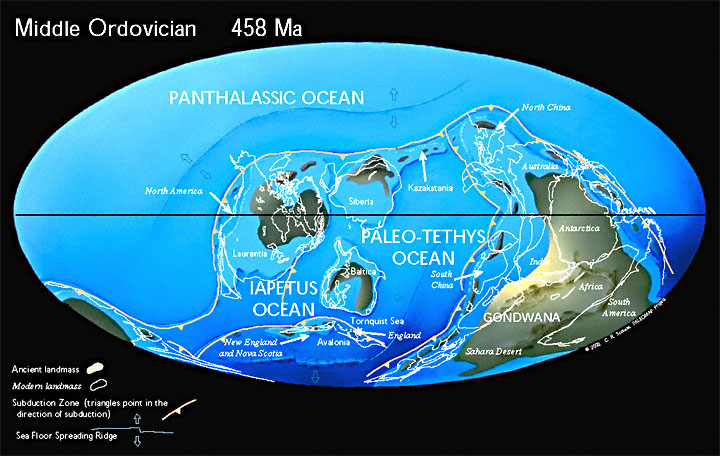
In fact, looking back through history at the positions of the land masses, I don't see any period of time where a circumequatorial current was possible.

About the closest thing I see to a circum equataorial current would be during the Ordovician period some 458 million years ago and even that could hardly be called circum equatorial.

458.jpg
 
Last edited:

Forum List

Back
Top