
ScienceRocks
Democrat all the way!
- Banned
- #1
Benchmarking IPCCs warming predictions
Posted on May 5, 2013 by Guest Blogger
Benchmarking IPCC?s warming predictions | Watts Up With That?
By Christopher Monckton of Brenchley
I'm posting pro and anti global warming stories...What do you think about this? Does it hold any truth. Discuss it.
Posted on May 5, 2013 by Guest Blogger
Benchmarking IPCC?s warming predictions | Watts Up With That?
By Christopher Monckton of Brenchley
The IPCCs forthcoming Fifth Assessment Report continues to suggest that the Earth will warm rapidly in the 21st century. How far are its projections short of observed reality?
A monthly benchmark graph, circulated widely to the news media, will help to dispel the costly notion that the world continues to warm at a rapid and dangerous rate.
The objective is to compare the IPCCs projections with observed temperature changes at a glance.
The IPCCs interval of temperature projections from 2005 is taken from the spaghetti-graph in AR5, which was based on 34 models running four anthropogenic-forcing scenarios.
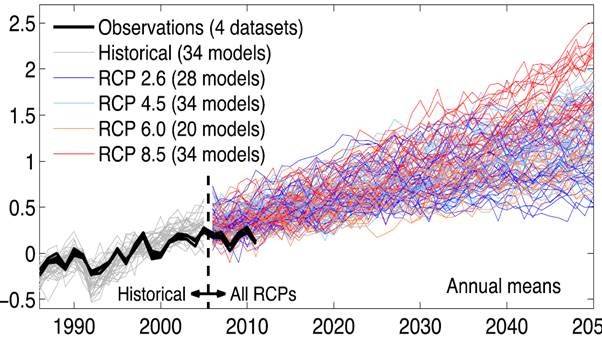
Curiously, the back-projections for the training period from 2005-2013 are not centered either side of the observational record (shown in black): they are substantially above outturn. Nevertheless, I have followed the IPCC, adopting the approximate upper and lower bounds of its spaghetti-graph.
The 34 models central projection (in yellow below) is that warming from 2005-2050 should occur at a rate equivalent to approximately 2.3 Cº/century. This is below the IPCCs long-established 3 Cº centennial prediction because the models expect warming to accelerate after 2050. The IPCCs upper-bound and lower-bound projections are equivalent to 1.1 and 3.6 Cº/century respectively.
I'm posting pro and anti global warming stories...What do you think about this? Does it hold any truth. Discuss it.