Arctic warming: Why record-breaking melting is just the beginning

More evidence of the rapid Arctic warming.

January hits new record low in the Arctic
The National Snow and Ice Data Center
Feb. 4, 2016

January Arctic sea ice extent was the lowest in the satellite record, attended by unusually high air temperatures over the Arctic Ocean and a strong negative phase of the Arctic Oscillation (AO) for the first three weeks of the month. Meanwhile in the Antarctic, this year’s extent was lower than average for January, in contrast to the record high extents in January 2015.

Overview of conditions
Arctic sea ice extent during January averaged 13.53 million square kilometers (5.2 million square miles), which is 1.04 million square kilometers (402,000 square miles) below the 1981 to 2010 average. This was the lowest January extent in the satellite record, 90,000 square kilometers (35,000 square miles) below the previous record January low that occurred in 2011. This was largely driven by unusually low ice coverage in the Barents Sea, Kara Sea, and the East Greenland Sea on the Atlantic side, and below average conditions in the Bering Sea and Sea of Okhotsk. Ice conditions were near average in Baffin Bay, the Labrador Sea and Hudson Bay. There was also less ice than usual in the Gulf of St. Lawrence, an important habitat for harp seals.

Conditions in context
The monthly average January 2016 sea ice extent was the lowest in the satellite record, 90,000 square kilometers (35,000 square miles) below the previous record low in 2011. The next lowest extent was in 2006. Interestingly, while 2006 and 2011 did not reach record summer lows, they both preceded years that did, though this may well be simply coincidence.

The trend for January is now -3.2% per decade. January 2016 continues a streak that began in 2005 where every January monthly extent has been less than 14.25 million square kilometers (5.50 million square miles). In contrast, before 2005 (1979 through 2004), every January extent was above 14.25 million square kilometers.

Figre2a.png

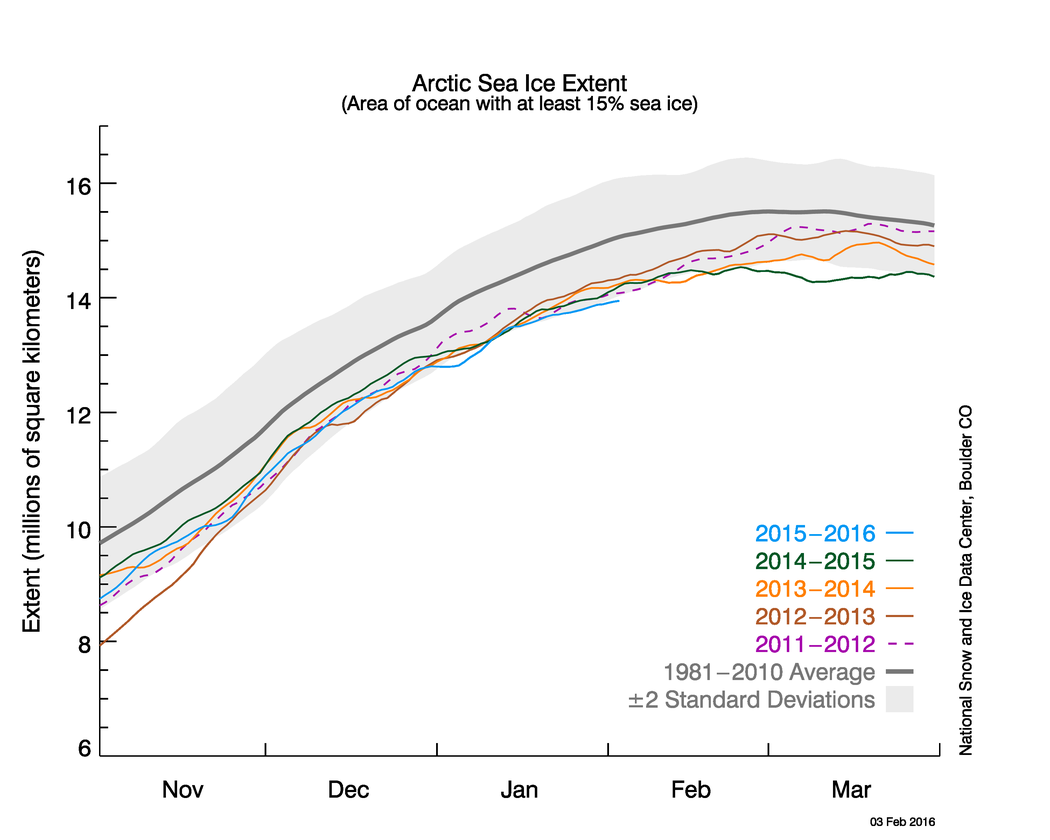
Credit: National Snow and Ice Data Center

Figure 2a. The graph above shows Arctic sea ice extent as of February 3, 2016, along with daily ice extent data for four previous years. 2015 to 2016 is shown in blue, 2014 to 2015 in green, 2013 to 2014 in orange, 2012 to 2011 in brown, and 2011 to 2012 in purple. The 1981 to 2010 average is in dark gray. The gray area around the average line shows the two standard deviation range of the data. Sea Ice Index data.
 
And consider that for the US, the last 30 days have seen huge areas of the US 3 degrees Centigrade to 8+ degrees Centigrade above normal temperatures for those areas.

http://www.cpc.ncep.noaa.gov/products/analysis_monitoring/lanina/enso_evolution-status-fcsts-web.pdf

And only about 5% of the US with less than normal temperatures.
It's going to be a very hot, record breaking year, with heat waves, extreme weather events, and the Arctic hitting a new record low in September.....and that spells doom for the laughable anti-science, reality-challenged, Global warming denying, Repuking candidates for President and Congress.....they just don't realize it yet. Watch their panic peak as Election Day approaches and everyone is laughing at them and their demented denial of reality.
 
Last edited:
And consider that for the US, the last 30 days have seen huge areas of the US 3 degrees Centigrade to 8+ degrees Centigrade above normal temperatures for those areas.

http://www.cpc.ncep.noaa.gov/products/analysis_monitoring/lanina/enso_evolution-status-fcsts-web.pdf

And only about 5% of the US with less than normal temperatures.
It's going to be a very hot, record breaking year, with heat waves, extreme weather events, and the Arctic hitting a new record low in September.....and that spells doom for the laughable anti-science, reality-challenged, Global warming denying, Repuking candidates for President and Congress.....they just don't realize it yet.
what's going to happen?
 
High & Low Weather Summary for the Past Weeks
Temperature Humidity Pressure
High
72 °F (Feb 29, 1:52 PM) 97% (Feb 16, 7:52 AM) 30.56 "Hg (Feb 16, 7:52 AM)
Low 27 °F (Feb 14, 1:52 PM) 24% (Feb 14, 2:52 PM) 29.37 "Hg (Feb 24, 2:52 PM)
Average 47 °F 62% 30.07 "Hg
* Reported Feb 14 1:52 PM — Feb 29 1:52 PM, Charlotte, Weather by CustomWeather, © 2016
Yesterday's and last weeks' weather in Charlotte, North Carolina, U.S.A.

By the charts here;

http://www.cpc.ncep.noaa.gov/products/analysis_monitoring/lanina/enso_evolution-status-fcsts-web.pdf

For the last 90 days, 1 to 3 degrees warmer than average for the Carolinas. Page 30. For the last 30 days, -1 to 1 degree from normal. Page 29.
 
here, since I mentioned it a few posts back, here is one website I found on the axis information I was referring to.

link,
Axis Shift & Epic Global Changes
Overview of Earth's axis shifts since 2004

  • The earth's axis underwent a significant shift in Dec 2004

  • It was the shifting of the Earth's axis which caused the Indonesian Tsunami which killed a quarter million people in 2004

  • The axis shift is one of many subjects Classified TS by the world governments.

  • Since 2004, the sun has been rising & setting "NORTH" of the US in June

  • The sun should never be farther north than the Tropic of Cancer on June 21st, the summer solstice.
etc.......
ROTFLMFAO......we can always trust ol' JustCrazy to come up with the most crackpot pseudo-science websites on the Internet......and the poor retarded clown is ignorant and gullible enough to fall for them every time.
 
Old Crock just doesn't get it...

PACK ice is compacted sea ice.. Pack ice has increased by 11% while sea ice has decreased.. WIND CAUSES THIS, OCEAN CURRENTS CAUSE THIS... The temp trends your posting are highly ADJUSTED UPWARD homogenized CRAP!

In other words.. Your alarmism is all BULL SHIT! The warming, slight that it is, was caused by the dying El Niño not MAN...

Get a dam grip Old Crock.. Your looking for a CAGW boogie man in every dam thing that happens and it just is not true... Loosen up that tinfoil, it's killing blood flow to your last brain cell.
 
And consider that for the US, the last 30 days have seen huge areas of the US 3 degrees Centigrade to 8+ degrees Centigrade above normal temperatures for those areas.

http://www.cpc.ncep.noaa.gov/products/analysis_monitoring/lanina/enso_evolution-status-fcsts-web.pdf

And only about 5% of the US with less than normal temperatures.
It's going to be a very hot, record breaking year, with heat waves, extreme weather events, and the Arctic hitting a new record low in September.....and that spells doom for the laughable anti-science, reality-challenged, Global warming denying, Repuking candidates for President and Congress.....they just don't realize it yet.
what's going to happen?
Your head is going to explode. Obviously.
 
Could the OP display for us where, outside the realm of the internet forums, Hollywood and academia, anybody is caring about this?

Really.......the AGW internet bozo's have been crooning about this stoopid stuff for 25 years and nothing has changed in the real world. Most of the population has simply tuned out the gibberish.

So........show us where they are caring.........links please s0n................


Good luck!!!:eusa_dance::eusa_dance::up:
 
Last edited:
And consider that for the US, the last 30 days have seen huge areas of the US 3 degrees Centigrade to 8+ degrees Centigrade above normal temperatures for those areas.

http://www.cpc.ncep.noaa.gov/products/analysis_monitoring/lanina/enso_evolution-status-fcsts-web.pdf

And only about 5% of the US with less than normal temperatures.
It's going to be a very hot, record breaking year, with heat waves, extreme weather events, and the Arctic hitting a new record low in September.....and that spells doom for the laughable anti-science, reality-challenged, Global warming denying, Repuking candidates for President and Congress.....they just don't realize it yet.
what's going to happen?
Your head is going to explode. Obviously.
groupcrickets.jpg
 
Here's a great, in-depth, and very informative article on the extreme changes happening in the Arctic, that National Geographic put together a few months ago, that covers and reinforces many of the points made in the OP. It is full of actual quotes from the scientists studying the Arctic and links to the sources and background of the points being made.

Unfortunately, this article is quite likely way too much information for the low-attention-span rightwingnut denier cultists to handle. This also gives them an excuse to refuse to read anything that debunks their moronic anti-science myths and fantasies.

Extreme Research Shows How Arctic Ice Is Dwindling
What happens when the planet loses some of its ability to cool itself?

National Geographic
Story by Andy Isaacson
Photographs by Nick Cobbing
PUBLISHED DECEMBER 14, 2015

MM8407_150218_00571-640.jpg

To track changes in sea ice, the Norwegian research vessel Lance drifted along with it for five months in 2015, on a rare voyage from Arctic winter into spring. In late February the sky hints at the coming of the sun.

THE SEA ICE THAT BLANKETS THE ARCTIC OCEAN isn’t the unbroken white mantle depicted in maps. It’s a jigsaw puzzle of restless floes that are constantly colliding, deforming, and fracturing from the force of wind and ocean currents. Last February I stood shivering on the deck of the Lance, an old Norwegian research vessel, as it picked a path through a labyrinth of navigable fractures. A barren white plain of ice and snow extended to the horizon in every direction. The ship’s steel hull shuddered and screeched as it plowed through floating chunks of jagged ice. The Lance was seeking a solid patch of ice to attach to—the last one had shattered—so that it could resume its erratic drift across the frozen sea, charting the fate of Arctic sea ice by going with the floe.

The Norwegians have done this before, more than a century ago, when polar explorer Fridtjof Nansen and the Fram were locked in pack ice for nearly three years during a vain attempt to drift across the North Pole. But the Arctic is a different ocean now. The air above it has warmed on average about 5 degrees Fahrenheit in the past century, more than twice the global average. Much less of the ocean is covered by ice, and much more of that ice is thinner, seasonal ice rather than thick, old floes. A feedback loop with far-reaching consequences has taken effect: As white ice is replaced in summer by dark ocean water, which absorbs more sunlight, the water and air heat further—amplifying the ongoing thaw.

The Arctic warms first, most, and fastest,” explains Kim Holmén, the long-bearded international director of the Norwegian Polar Institute (NPI), which operates the Lance. Climate models predict that by as early as 2040 it will be possible in summer to sail across open water to the North Pole.

Arctic sea ice helps cool the whole planet by reflecting sunlight back into space. So its loss inevitably will affect the climate and weather beyond the Arctic, but precisely how remains unclear. Better forecasts require better data on sea ice and its shifting, uneven distribution. “Most scientific cruises to the Arctic are conducted in summer, and this is where we have the most field data,” says Gunnar Spreen, an NPI sea-ice physicist I met on board the Lance.The continuous changes that occur from winter into spring are a huge gap in our understanding.

MM8407_150305_05014-2048.jpg

In dense fog, sea ice scientists pass in front of the Lance, dragging instruments for measuring ice thickness. Fog adds danger to the work: It’s harder to spot approaching polar bears.

On the Lance’s five-month mission its rotating crew of international scientists would investigate the causes and effects of ice loss by monitoring the ice across its entire seasonal life cycle—from the time when it formed in winter until it melted in summer.

A few days after photographer Nick Cobbing and I joined the ship by icebreaker and helicopter from Longyearbyen, on the island of Spitsbergen in the Svalbard archipelago—the base for NPI’s Arctic operations—the Lance steamed to 83 degrees north, just west of Russian territory. The scientists singled out a half-mile-wide floe of predominantly seasonal ice that they hoped to study. The crew tethered the vessel to the floe with nylon ropes attached to thick metal poles driven into the ice. They shut off the main engine. Isolated and in near darkness, we began our wayward drift and our month-long shift in the ice desert.

Like homesteaders, the scientists established camps on the floe, pitching tents and laying electric cables. Physicists like Spreen mapped the ice topography with lasers and recorded the thickness and temperature of the snow on top. Oceanographers bored a hole through the ice to gather data about the water and the currents. Meteorologists erected masts carrying instruments to collect weather data and measure greenhouse gases. Biologists searched for ice algae, which look like dirt and live on the underside of the ice and in the channels of trapped brine left after newly formed sea ice expels salt. In a few weeks, after the returning sun cast aside the cloak of polar night and began filtering through the melting floe, the scientists would watch the ecosystem awaken.

Temperatures regularly plunged to 30 degrees below zero Fahrenheit. Scientists had to contend with numb fingers, snapped cables, and crippled electronic instruments, along with the danger of roving polar bears. “This is really extreme science,” one researcher said.

The Arctic really is the canary showing that climate change is real.
—OCEANOGRAPHER JAMES OVERLAND

MM8407_150304_04531-2048.jpg

In early March, after shoveling away three feet of snow, scientists from the Lance melt a hole through the ice to collect plankton and water samples. Most Arctic fieldwork is carried out between spring and fall.

IN 2007 THE UN INTERGOVERNMENTAL PANEL ON CLIMATE CHANGE (IPCC) warned that the impacts of climate change in the Arctic over the next century “will exceed the impacts forecast for many other regions and will produce feedbacks that will have globally significant consequences.” Nearly a decade later this grim forecast is already being borne out. Probably no region has been more affected by climate change than the Arctic. Permafrost is thawing, and the land is greening, as tree lines creep north and shrubs and grasses invade the tundra. Certain populations of polar bears, walruses, and caribou have suffered significant declines. National Oceanic and Atmospheric Administration (NOAA) oceanographer James Overland says, “The Arctic really is the canary showing that climate change is real.

Since 1979, when satellite records began, the Arctic has lost more than half its volume of ice, which has diminished in both overall area and thickness. The frozen area shrinks to its annual minimum in September, at summer’s end. In September 2012 its extent was just half the average during the 1980s and ’90s. The maximum ice extent in winter, usually reached in March, also is declining, though at a slower rate; its average thickness has decreased by half. What was once mostly a layer of 10- to 13-foot-thick ice floes that lingered for years—perennial ice—has given way to large tracts of thinner, less reflective ice that forms and melts during a single year. Sea-ice coverage has always fluctuated naturally, but there’s little doubt among scientists that man-made greenhouse gases are now accelerating its decline. “Old, thick sea ice was a global reservoir for cold, but that is now changing,” Overland says.


See for Yourself: How Arctic Ice Is Disappearing
Since satellites began regularly measuring Arctic sea ice in 1979, it has declined sharply in extent and thickness.

NationalGeographic_1198366-2048.jpg

The Lance had a predecessor: In the 1890s the Norwegian ship Fram drifted for three years in the Arctic ice. Led by Fridtjof Nansen (second from left), the explorers failed to reach the North Pole, but they collected valuable data. “A lot of our current knowledge about the Arctic climate is based on their observations,” says sea-ice physicist Gunnar Spreen. - NATIONAL LIBRARY OF NORWAY

An entire ecosystem is melting away. The loss of sea ice may take a toll on some of the photosynthesizing organisms that fuel the marine food chain—single-celled algae that live under the ice and bloom in the spring when the light returns. Changes in the magnitude and timing of these blooms, as winter ice retreats faster and earlier, may throw off the life cycle of tiny, fatty zooplankton called copepods, which eat the algae and are in turn eaten by arctic cod, seabirds, and bowhead whales. For marine mammals such as the polar bear, Pacific walrus, and ringed seal, the loss of hundreds of thousands of square miles of sea ice has already been devastating. “It’s like someone took the floor out from under you,” says Kristin Laidre, a polar scientist at the University of Washington.

The assumption is that later this century, without a home field, these animals will simply lose all competitive advantage. Killer whales, for example, are likely to replace polar bears as the top marine predators, as bears retreat to the dwindling remnants of summer sea ice. Though polar bears sometimes spend time on land, where lately a few have been hybridizing with grizzlies, Ian Stirling of the University of Alberta, a leading polar bear expert, dismisses any notion that they could survive long-term on land as “wishful thinking.” Ice-free conditions are likely to draw in other competitors—zooplankton (maybe less fatty and nutritious ones), fish, seals—from more temperate waters.

Ice loss is also making the Arctic even more vulnerable to ocean acidification, another effect of rising atmospheric carbon dioxide. Cold water absorbs more CO₂ than warm water does, and more cold water is now open to the air. As the water acidifies, it loses carbonate. Within the next 15 years it may no longer contain enough for animals such as sea snails and Alaska king crabs to construct and maintain their calcium-carbonate shells.

The upshot of all this, as Stirling bluntly puts it: “The Arctic marine ecosystem as we know it now will no longer exist.

WARMER AIR ABOVE THE OCEAN BASIN IS PROJECTED TO SPILL DOWN over the surrounding coasts of Russia, Alaska, and Canada, causing feedback effects as far as 900 miles inland, including accelerated melting of the Greenland ice sheet and large emissions of carbon dioxide and methane from thawing tundra. IPCC models forecast that the total loss of summer sea ice may in itself cause one-third of the warming of the Northern Hemisphere and 14 percent of total global warming by the end of the century.

How a rapidly warming Arctic will influence weather across the hemisphere is a bit hazier. Atmospheric scientists Jennifer Francis at Rutgers University and Steve Vavrus at the University of Wisconsin have suggested that people in the continental United States already may be feeling the effects of melting Arctic sea ice—especially in the past two winters in the east, which made “polar vortex” household words.

DSC_9516-2048.jpg

In late April biologists Piotr Kukliński, Pedro Duarte, and Haakon Hop (left to right) prepare to dive through a hole in the ice, into a world just being awakened by the spring sun. - PETER LEOPOLD, NORWEGIAN POLAR INSTITUTE (NPI)

DSD_3403-2048.jpg

Wearing a dry suit, Kukliński observes the flora and fauna living under thick, perennial ice. The ice floe and around 15 inches of snow on its surface reflect most sunlight, darkening the ocean below. - PETER LEOPOLD, NPI

The polar vortex is the mass of cold air that’s normally confined over the Pole by the polar jet stream—the high-altitude, fast-moving torrent of air that snakes around the Pole from west to east. The jet stream draws most of its energy from the contrast in temperature and pressure between the frigid air to its north and the warmer air to the south. As sea-ice loss amplifies the warming in the Arctic, the Francis theory goes, that contrast is reduced, weakening the jet stream’s westerly winds. It becomes a lazier, more sinuous river, with large meanders that extend far to the south and north. Because the meanders advance slowly across the map, whatever weather they enfold persists for a long time. During the past two winters the wavier pattern allowed Arctic air and extreme snow to beset New England and drought to linger over California. The melting Arctic may be affecting weather elsewhere too. Korean researchers have linked extreme winters in East Asia to air-circulation changes caused specifically by ice loss in the Barents-Kara Sea.

It’s a neat theory, but parts of it remain “fuzzy,” Francis admits. Also, many researchers who study atmospheric dynamics aren’t buying it. A more plausible explanation for the wavier jet stream and the southward excursions of the polar vortex, some of them argue, is the influence of the tropical Pacific, which is a far more powerful source of heat than the Arctic. It will take years of data gathering and modeling to settle the debate.

MM8407_150304_04171-2048.jpg

This piece of Arctic sea ice froze fast on a cold, calm night; polarized light shining through the thin section reveals tightly packed columns of crystals.

In any case, as the warming of the planet continues, cold spells of any kind will become less common. Even if sharp limits on greenhouse gas emissions are adopted over the next 20 years, the decline of sea ice will continue for decades. “We’re on a one-way trip and not going back,” says Overland. A further rise of 4 degrees Celsius (7.2 degrees Fahrenheit) in the Arctic is all but assured by mid-century, he says, enough to keep the ocean ice free for at least two months of the year, enough to change the seasons there — “enough to affect everything.

MM8407_150317_07331-2048.jpg

In a fracture behind the Lance, water vapor meets chill air and freezes to “sea smoke.” As dark water replaces ice, the Arctic Ocean absorbs more heat in summer and releases more in fall and winter—perhaps affecting weather elsewhere.

IN LATE JUNE, DURING THE FINAL PHASE OF THEIR EXPEDITION, the scientists aboard the Lance awoke to discover that the latest ice floe they’d attached to was disintegrating too. They scrambled to salvage their gear before it became flotsam. It was time to pack up anyway. The vessel by that point had spent 111 days in the ice, tethered to different floes for several weeks at a time—logging altogether some 4,000 nautical miles across the Arctic. Polar bears had crossed its path, sometimes pausing to play with the scientists’ strange-looking electronic instruments. Storms had bulldozed huge blocks of ice high against the ship, elevating it above the surface. The Lance’s crew had bested the researchers in a soccer match on the floe. Over the next couple of years the 68 scientists involved will be hunkered in their warm labs, making sense of all the data they gathered.

One morning in March, under a dusky blue sky, I had joined Gunnar Spreen and another NPI researcher, Anja Rösel, on one of their periodic forays to measure changes in the ice floe’s thickness. We each wore insulated armor—jumpsuit, balaclava, goggles, gloves, mittens over the gloves. The scientists brought along a snow-depth probe, a GPS device, and an orange plastic sled carrying the ice-thickness instrument, which works by inducing an electric current in the seawater below. I carried a flare gun and a .30-06-caliber rifle: bear protection. Following a mile-long path staked by bamboo poles, we trudged over dunelike snowdrifts and pressure ridges—slabs of sea ice pushed up by colliding floes—that looked like crumbling stone walls. Every few feet Spreen stopped and plunged the depth gauge into the snowpack until it beeped to indicate that the measurement was complete.

Arctic warming seemed an abstract concept that day—I couldn’t really feel my toes—but across the icescape, Spreen saw evidence of change. “This is an unusual amount of snow,” he noted. Two feet of it lay beneath our moon boots, twice the amount in a typical year. One data point doesn’t make a trend, but this one was consistent with model forecasts: As sea ice shrinks, the extra heat and water vapor released from the open water into the lower atmosphere should generate more precipitation.

More snow falling on a glacier on land would be a good thing, because that’s how glaciers grow—by accumulating layers of snow so thick that the stuff at the bottom gets compressed into ice. But sea ice forms when cold air freezes seawater, and snow falling on top of it acts as an insulating blanket that slows the growth of the ice. As it happened, two weeks after my walk with Spreen, the National Snow and Ice Data Center in Colorado announced that Arctic sea ice had already reached its maximum extent for the winter in late February—much earlier than usual. It was the lowest maximum the satellites had ever recorded.

MM8407_150313_07042-2048.jpg

Driven by winds and currents, the pieces of the Arctic ice puzzle are constantly shifting. Here a floe has fractured, and the open water is freezing alongside a pressure ridge that formed where two earlier floes collided.

More About Arctic Ice

EXTREME WEATHER

The Arctic Connection

SEE FOR YOURSELF

 
toiletpaper://wattsupwiththat.files.wordpress.com/2016/03/percentage-of-ocean-that-has-sea-ice-cover.jpg?w=960&h=90

Looks to me like global sea ice is in good shape... even if we have a bit of melt were in dang good shape...

Citing a lying, fossil fuel industry sponsored, denier cult blog only impresses the other ignorant rightwingnut retards.

Arctic sea ice is NOT in "good shape", Boober. It is rapidly declining in both extent and volume.

Trying to conflate the rapidly and massively declining Arctic sea ice with the very seasonal, temporarily increasing Antarctic sea ice is another fraudulent denier cult propaganda meme. The Antarctic sea ice is insignificant compared to the land-based ice resting on the continent of Antarctica.
wow, dude you are out of control. I see you can't have a discussion on anything in here. I believe the charts show the ice is just fine and in a normal build range. And you're behaving as if the arctic was empty ice. Just wow. I see integrity avoids you.
OK, JustCrazy, keep your head up your ass.

The scientific facts about the current state of the Arctic ice cap have been posted on this thread and others. You are blind to those facts exactly because your head is jammed so far up your ass.

The Arctic ice cap is greatly reduced in extent and volume and the decline in ice is still accelerating. This year saw the lowest and earliest maximum ice extent on record. 2016 will, almost certainly, see the next new record minimum extent next September, even lower than the record low reached in 2012. Volume will be at a new record low as well.
scientific facts? hahahahhahhahaahaha which ones are those? Please post up facts. The main fact I know is that the arctic has ~the same ice today as it had 30 years ago. And you got shit.
 

Forum List

Back
Top