Arctic Sea Ice News and Analysis | Sea ice data updated daily with one-day lag
← Previous Article
2017 ushers in record low extent
February 7, 2017
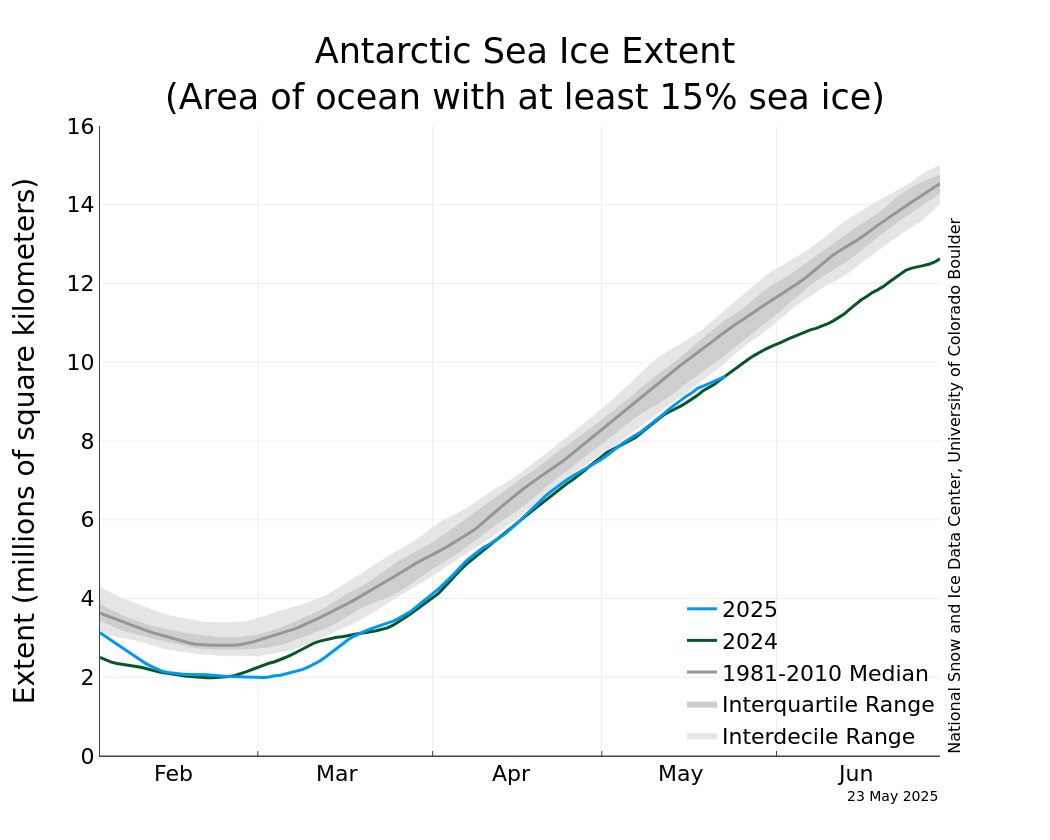
Record low daily Arctic ice extents continued through most of January 2017, a pattern that started last October. Extent during late January remained low in the Kara, Barents and Bering Seas. Southern Hemisphere extent also tracked at record low levels for January; globally, sea ice cover remains at record low levels.
..................................................................................................
Extent is tracking at records low levels in the Southern Hemisphere, where it is currently summer. As shown in this plot for February 5, this is primarily due to low ice extent within the Amundsen Sea, where only a few scattered patches of ice remain. By contrast, extent in the Weddell Sea is now only slightly below average. This pattern is consistent with persistent above average air temperatures off western Antarctica.
Record low ice at both poles. Three extreme warmups in the Arctic this winter. Yet our 'Conservatives' are still claiming that nothing is happening.
/---- Sure it is Spanky- sure it is