Arctic Ice stable since 1979!!!!

Arctic ice extent this year will end up between the 4rth and 6th lowest year ever. Lower than 2013 and 2014, higher than 2012. There's not much melt left to happen, so the final tally now depends mostly on how much the winds compact or spread the ice.

So, with average melt conditions, it's still a low year. Low is the new normal. And eventually, another year with favorable melt conditions will happen, and a new record low will be set.

Some profoundly stupid people call that stable. That's why everyone laughs at them and then just ignores them, because they're stupid.

VIsualization Service of Horizontal scale Observations at Polar region

So?

What's your point?

Do you have an experiment that control for all variable except a wisp of CO2? No, I didn't think so
 
What's your point?

First, that you can't read.

Second, that ice levels keep declining due to global warming.

Third, that you have to a complete retard to deny that.

If you need it dumbed down any more than that, you're ought of luck.


Sooooo, whatever happened to the claim that Arctic ice would be gone by 2013? And 2009 before that, and 2000 before that? Seems to me it's you all who keep saying things that aren't true.
 
What's your point?

First, that you can't read.

Second, that ice levels keep declining due to global warming.

Third, that you have to a complete retard to deny that.

If you need it dumbed down any more than that, you're ought of luck.

Google: scientific method

You're not even in the same universe


This is what we are dealing with here..........even in the face of a flat-line graph as displayed in post #1.........flat as a pancake for 35 years, they call us "retards"!!!:2up::eusa_dance::eusa_dance:
 
What's your point?

First, that you can't read.

Second, that ice levels keep declining due to global warming.

Third, that you have to a complete retard to deny that.

If you need it dumbed down any more than that, you're ought of luck.

Google: scientific method

You're not even in the same universe


LOL!!! You think trained scientist at the noaa, nasa and every science institution on the planet doesn't understand the scientific method!
 
What's your point?

First, that you can't read.

Second, that ice levels keep declining due to global warming.

Third, that you have to a complete retard to deny that.

If you need it dumbed down any more than that, you're ought of luck.

Google: scientific method

You're not even in the same universe


This is what we are dealing with here..........even in the face of a flat-line graph as displayed in post #1.........flat as a pancake for 35 years, they call us "retards"!!!:2up::eusa_dance::eusa_dance:


1. The global graph shows a slow decline...Not easy to read by you of course!
2. More moisture = more ice around Antarctica.
3. The much colder then freezing temperatures can afford to rise a few degrees = more ice.


The arctic doesn't suffer from this as the arctic ocean is open water with thin sea ice.

Please think about it before calling people retarded.


s0n.......please show us where I called somebody retarded. "Retarded" is a term that is used in conjunction with intelligence. Ive made this point many times. Frankly, the AGW religion people are probably a lot smarter than me, however, thought processing is a completely different matter. Given Ive been in the field for 30 years, I can confidently say that there is a fair amount of OCD going on in the alarmist community. That's a thought processing issue specifically related to depression........you'd find that virtually all of the alarmists in here have some family history of depression on either the father or mothers side possibly as far as 2-3 generations back. Its also known as a mental disorder s0n..................

Obsessive compulsive disorder falls under the umbrella of depression.:eusa_dance:


Treatment? SSRO or SSRI medication.
 
Last edited:
What's your point?

First, that you can't read.

Second, that ice levels keep declining due to global warming.

Third, that you have to a complete retard to deny that.

If you need it dumbed down any more than that, you're ought of luck.

Google: scientific method

You're not even in the same universe


LOL!!! You think trained scientist at the noaa, nasa and every science institution on the planet doesn't understand the scientific method!

Clearly not.
 
What's your point?

First, that you can't read.

Second, that ice levels keep declining due to global warming.

Third, that you have to a complete retard to deny that.

If you need it dumbed down any more than that, you're ought of luck.

Google: scientific method

You're not even in the same universe


LOL!!! You think trained scientist at the noaa, nasa and every science institution on the planet doesn't understand the scientific method!
have you heard about the first Apollo astronauts who died on Apollo 1? Really, are you that naive that you don't think coverups happen in Government? Money will always reign as supreme qualifier to someone's view in government. Once there is a cover up, incriminates for life. Oh and what about the Challenger Shuttle? Yeah, NASA has a quality past. Government cover ups happen all the time. Ask the guy in Russia, how about Benghazi? dude, those are off the top of my head. More research would provide more, but not for the sake of this argument. See, you have nothing to support there isn't a cover up on temperature collection.

Oh, and what about UFO sightings being covered up. Global climate seems like easy pickens since no one is allowed to challenge them.
 
Last edited:
What's your point?

First, that you can't read.

Second, that ice levels keep declining due to global warming.

Third, that you have to a complete retard to deny that.

If you need it dumbed down any more than that, you're ought of luck.

Google: scientific method

You're not even in the same universe


This is what we are dealing with here..........even in the face of a flat-line graph as displayed in post #1.........flat as a pancake for 35 years, they call us "retards"!!!:2up::eusa_dance::eusa_dance:
I'm back today. Tooth feels your graph because it was global is not valid. Although, what he doesn't seem to get is that it represents the Arctic and shows no signs of ice loss. It's those small technical differences that sometimes get missed. Like what I fell for.
 
Sooooo, whatever happened to the claim that Arctic ice would be gone by 2013? And 2009 before that, and 2000 before that? Seems to me it's you all who keep saying things that aren't true.

Sooooooo, you're just doing that denier thing again. You know, where you fabricate a phony prediction, and then declare victory when it didn't happen. It's a denier staple tactic. They can't do much else, given the complete failure of their own predictions, and the excellent success record of mainstream climate science.

Now, if you want to prove you're not just making crap up, simply show us such a claim in any of the IPCC reports.

But if you are just faking it again, run off and cherrypick some out-of-context or flat-out-faked statements from some single individual that no one cares about. You know you want to. It's what you're good at, and you should stick with what you're good at.
 
Last edited:
The story here is a bit warped. I don't do ice.. But if I did --- the story here is a potentially more accurate satellite to measure sea ice volume. Has just a 5 yr record of volume. Covers the 2012 minimum and the subsequent recovery. Nothing to claim here. EXCEPT...

Arctic sea ice could COMPLETELY disappear at peak summer and that whole situation could turn around in 15 to 20 years. That's NOT climate time scale. It's different from the S. Pole because Arctic ice is mostly less than 6 or 8 years old and can regenerate that quickly..

It really really really is a very bad indicator of Global Warming.. It does NOTHING but grow 10 months of the year. And only about 3 months matter at all to it's melt rate..
 
I'm back today. Tooth feels your graph because it was global is not valid.

This graph?

Anyone saying "Arctic ice has been stable since 1979" is simply lying, proudly and flagrantly. Given how obvious the decline is, "deliberate dishonesty" is the only possible reason for saying something so crazy.

seaice.anomaly.arctic.png

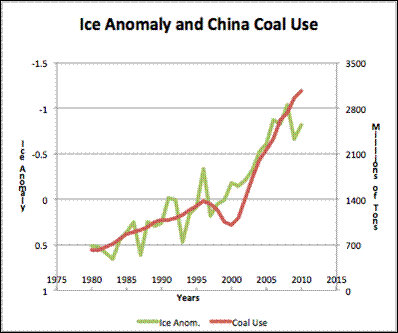
Soot from China fits that perfectly well

Caryl_31.gif
 
I'm back today. Tooth feels your graph because it was global is not valid.

This graph?

Anyone saying "Arctic ice has been stable since 1979" is simply lying, proudly and flagrantly. Given how obvious the decline is, "deliberate dishonesty" is the only possible reason for saying something so crazy.

seaice.anomaly.arctic.png


And.....if you put the information from 1970 to 1979 onto that graph of yours.....you would see a mirror image of what you presented. Your cronies start that fraudulent graph when sea ice was at its highest level. They ignore the cyclical nature of Arctic sea ice.
 
And.....if you put the information from 1970 to 1979 onto that graph of yours.....

Good idea. Let's do exactly that.

Arctic sea ice before satellites | Icelights: Your Burning Questions About Ice & Climate

mean_anomaly_1953-2010-300x190.png


http://arctic.atmos.uiuc.edu/SEAICE/timeseries.1870-2008

1870_2010.jpg


you would see a mirror image of what you presented.

Clearly not true, as it doesn't resemble a mirror image at all. It shows steady levels until a downturn begins around 1950.

Your cronies start that fraudulent graph when sea ice was at its highest level.

Clearly not true. 1979 is part of the downtrend, and is not an especially high year.

They ignore the cyclical nature of Arctic sea ice.

Clearly not true, given there is no indication of any "cyclical nature" since 1900.

So Westwall, why did you so proudly state the exact opposite of the truth here?
 

Forum List

Back
Top