Navigation
Install the app
How to install the app on iOS
Follow along with the video below to see how to install our site as a web app on your home screen.

Note: This feature currently requires accessing the site using the built-in Safari browser.
More options
You are using an out of date browser. It may not display this or other websites correctly.
You should upgrade or use an alternative browser.
You should upgrade or use an alternative browser.
Another low ice year for the Arctic
- Thread starter Old Rocks
- Start date

Hansen et al. 1981So the scientists at the University of Washington are all liars? When you say something could happen, you are predicating that on the evidence you have in front of you. Gore made a silly mistake of thinking that a fast dip might represent the trend. The line that we see here represents the trend.No, that is not what was said at all. Once again, you prove what a liar you are, Mr. Westwall. What was said was that it could be ice free as soon as 2013. But that is irrelevant, considering that the amount of ice has been declining every decade since we started monitoring by satellite.Hey, you are the clowns who have been telling us that the Arctic would be ice free by 2013. How did those predictions pan out again?

And that is the problem with ALL of your so called predictions olfraud. Whenever you use the word "could", or "might" you are not making a prediction. You are spewing propaganda. They are weasel words, used so that if you are lucky and the "prediction" comes true you can scream "see, we predicted this" but, when the "prediction" doesn't happen, which IS the overwhelming result of every claim you idiots make, you can say..."well, we only said it "might" happen. That's why no one with a brain pays the slightest attention to you clowns anymore.
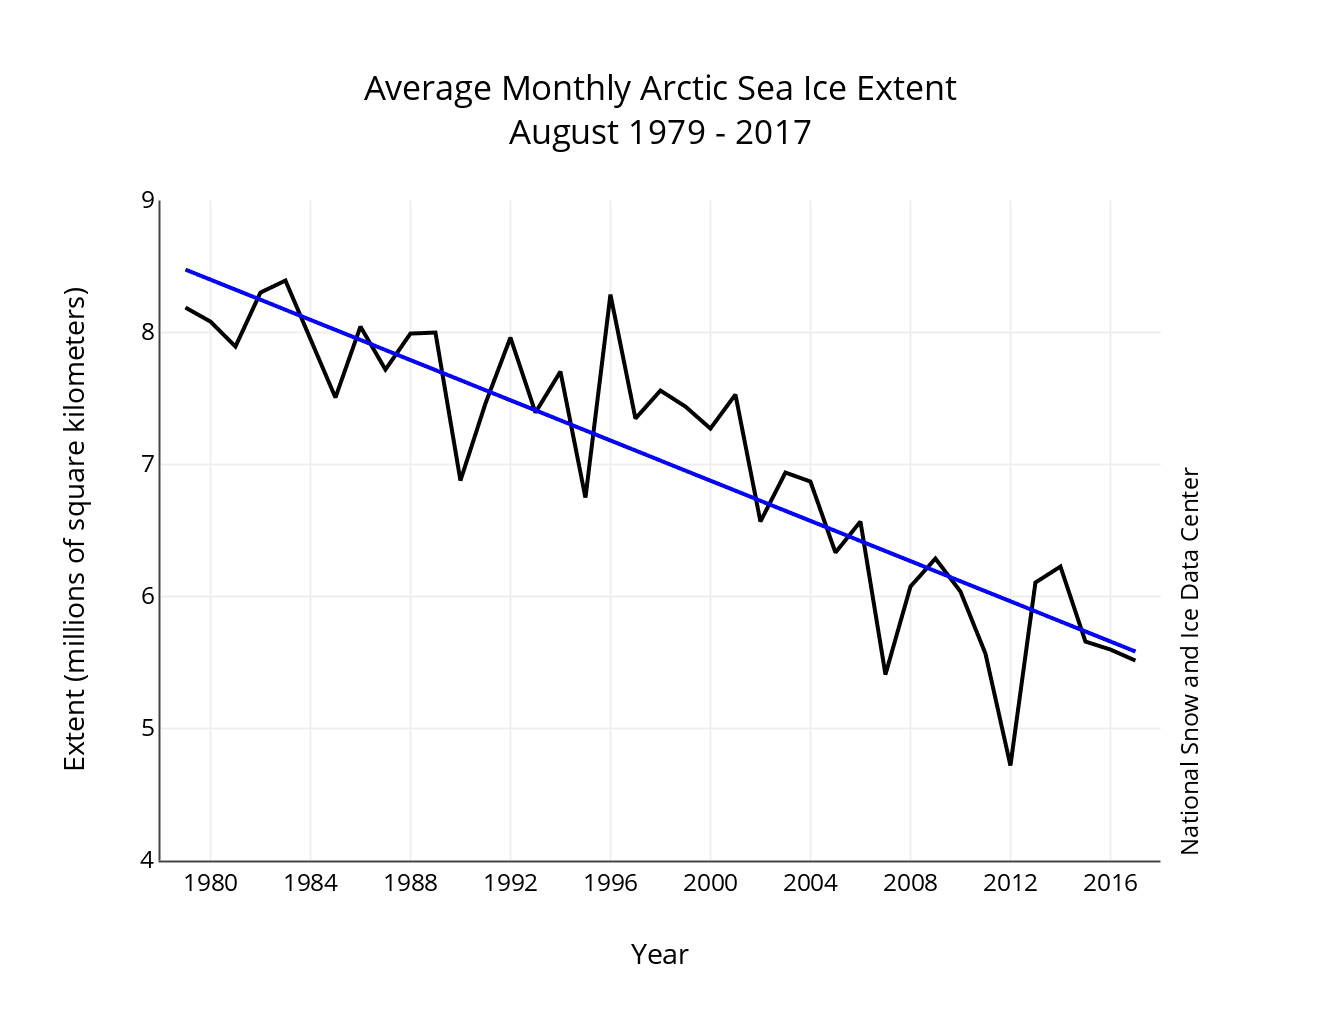
Figure 3. Monthly August ice extent for 1979 to 2017 shows a decline of 10.5 percent per decade.
Credit: National Snow and Ice Data Center
High-resolution image
Image 4 of 8 (play slideshow) Download
September | 2017 | Arctic Sea Ice News and Analysis
How about you address what I said clown boy. I stated very clearly that your hero's make no predictions and gave the reason why. Refute that.
Hansen, J., D. Johnson, A. Lacis, S. Lebedeff, P. Lee, D. Rind, and G. Russell, 1981: Climate impact of increasing atmospheric carbon dioxide. Science, 213, 957-966, doi:10.1126/science.213.4511.957.
The global temperature rose 0.2°C between the middle 1960s and 1980, yielding a warming of 0.4°C in the past century. This temperature increase is consistent with the calculated effect due to measured increases of atmospheric carbon dioxide. Variations of volcanic aerosols and possibly solar luminosity appear to be primary causes of observed fluctuations about the mean trend of increasing temperature. It is shown that the anthropogenic carbon dioxide warming should emerge from the noise level of natural climate variability by the end of the century, and there is a high probability of warming in the 1980s. Potential effects on climate in the 21st century include the creation of drought-prone regions in North America and central Asia as part of a shifting of climatic zones, erosion of the West Antarctic ice sheet with a consequent worldwide rise in sea level, and opening of the fabled Northwest Passage
Pubs.GISS: Hansen et al. 1981: Climate impact of increasing atmospheric carbon dioxide
Pretty definite predictions at a time that people like you were claiming that it was not happening. A later book, "Storms of our Grandchildren" predicted what we saw last year. All the predictions happened far sooner than expected. And here we are in a La Nina year, with El Nino temperatures.
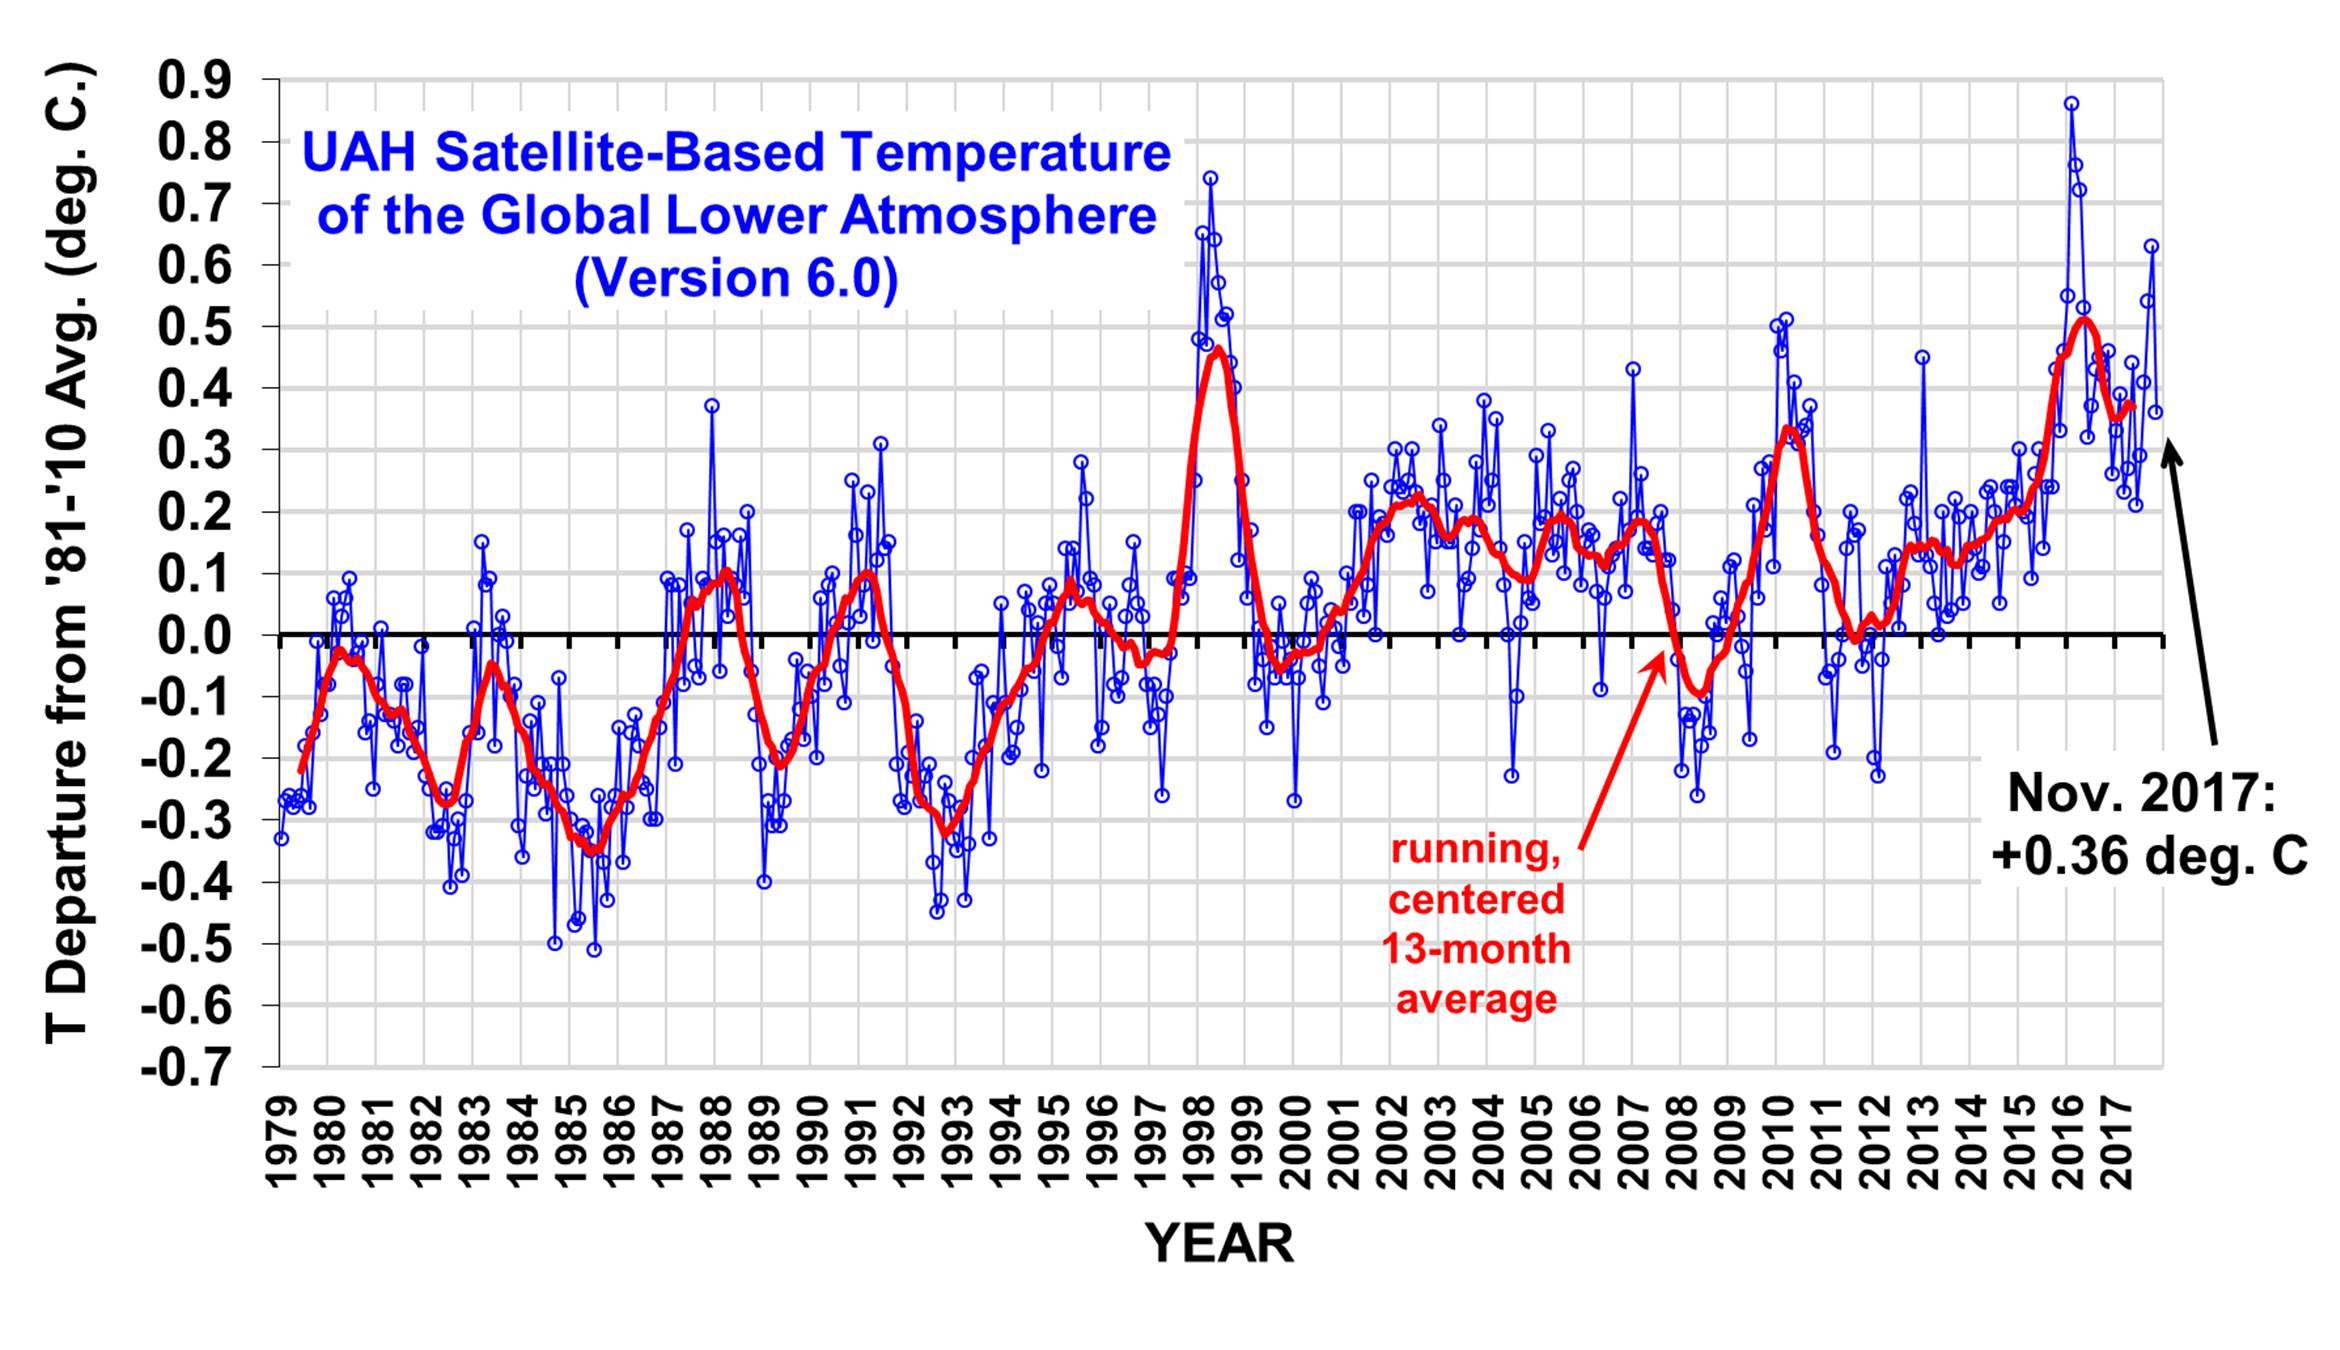
UAH Global Temperature Update for November 2017:+0.36 deg. C « Roy Spencer, PhD
And the last four years have been the warmest on record.
No, they aren't. That is a magical construct of homolugation computer models that take raw data and then warm it up so that they continue with their lies.

The result;
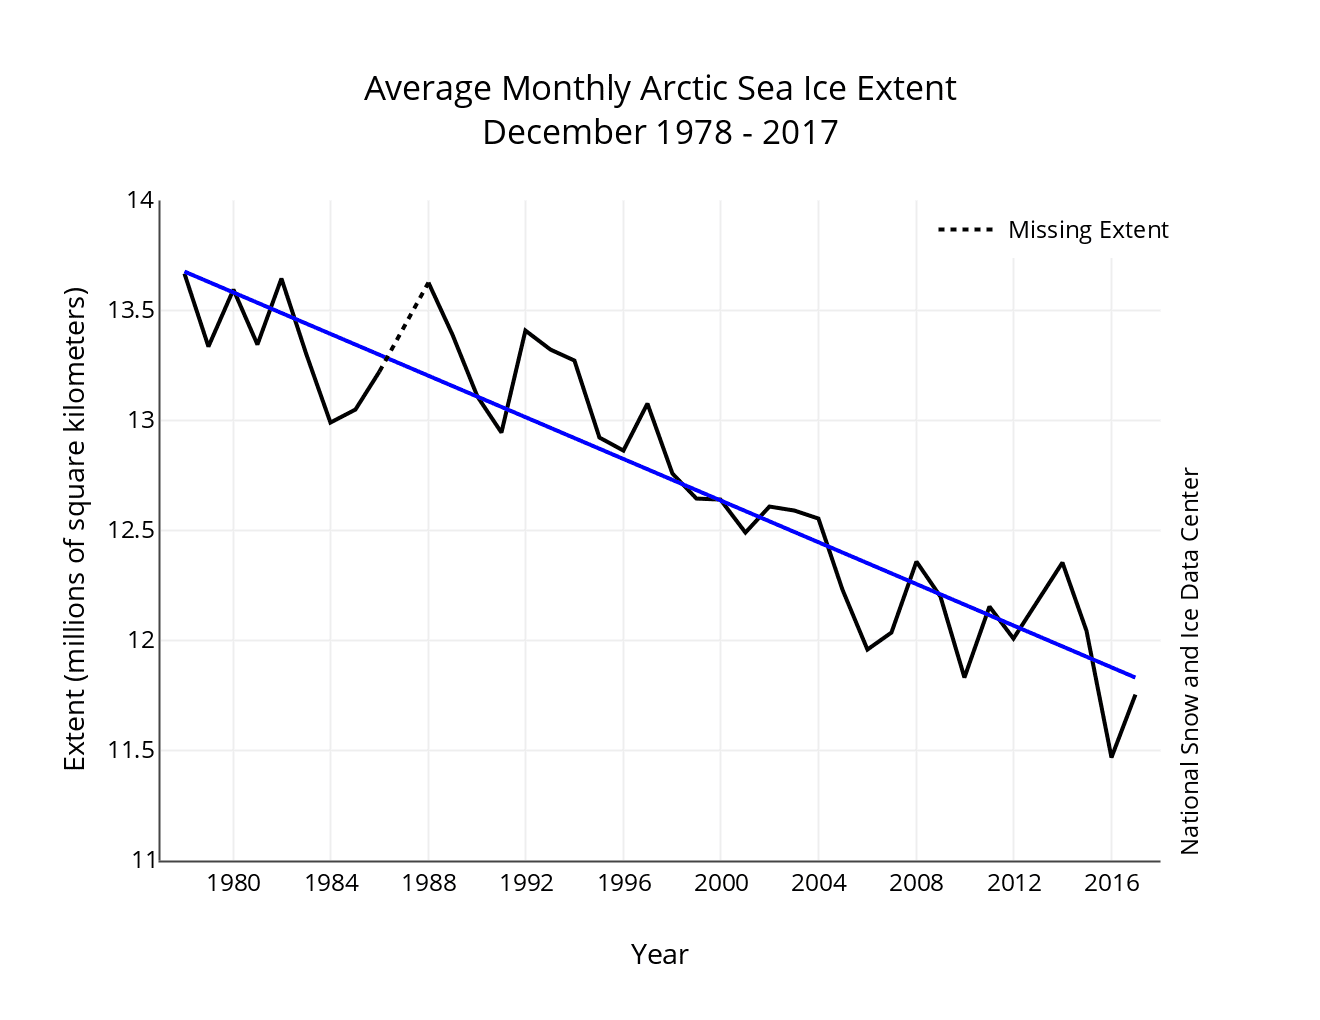
Figure 3. Monthly December ice extent for 1979 to 2017 shows a decline of 3.7 percent per decade.
Credit: National Snow and Ice Data Center
High-resolution image
Image 5 of 9 (play slideshow) Download
Arctic Sea Ice News and Analysis | Sea ice data updated daily with one-day lag
age 3 of 6 (play slideshow) Download

We have about a month and a half to make up for the presently low ice in the Arctic.
So what? We didn't cause it and there isn't shit we can do about it.
Billy_Bob
Diamond Member
LOL....And when we start paying the price even more than we did last year, the 'Conservatives' will blame the scientists for not informing them of the dangers. And the suckers out there will believe those lies.
FEAR MONGERING....
You think the last 50 years is long enough to show what our climate is doing?

Old Rocks
Diamond Member
- Thread starter
- #25
Fear mongering? I think that the final tally for American homes severely damaged or destroyed will go over 600,000 when the final tally is in. That is just for one year. And does not include resources and infrastructure destroyed. Of course, a two bit burger flipper would not know about any of that.
- May 20, 2009
- 144,498
- 66,892
- 2,330
An area that -22F is red.
HmmKay
HmmKay
Old Rocks
Diamond Member
- Thread starter
- #27
Yes, we have caused it. That you prefer to believe that your knowledge is greater than that of almost all the scientists in the world is an indication of the abysmal depths of your ignorance.
The result;
Figure 3. Monthly December ice extent for 1979 to 2017 shows a decline of 3.7 percent per decade.
Credit: National Snow and Ice Data Center
High-resolution image
Image 5 of 9 (play slideshow) Download
Arctic Sea Ice News and Analysis | Sea ice data updated daily with one-day lag
age 3 of 6 (play slideshow) Download
We have about a month and a half to make up for the presently low ice in the Arctic.
So what? We didn't cause it and there isn't shit we can do about it.
Old Rocks
Diamond Member
- Thread starter
- #28
Well now, if that is the 2 meter anomaly map, yes, that is the case. That means that the normal temperature is - 32 C. Oh yes, Frankie boi, that map is in Celsius. Now Frankie boi, we know you cannot read simple prose, but you really need to practice reading simple maps.An area that -22F is red.
HmmKay
- May 20, 2009
- 144,498
- 66,892
- 2,330
Well now, if that is the 2 meter anomaly map, yes, that is the case. That means that the normal temperature is - 32 C. Oh yes, Frankie boi, that map is in Celsius. Now Frankie boi, we know you cannot read simple prose, but you really need to practice reading simple maps.An area that -22F is red.
HmmKay
-22F is melting the ice.
Sure
Old Rocks
Diamond Member
- Thread starter
- #30

Now just for Frankie boi;
Definition of anomaly
plural anomalies
1: something different, abnormal, peculiar, or not easily classified : something anomalous
- They regarded the test results as an anomaly.
: the angular distance of a planet from its perihelion as seen from the sun
Definition of ANOMALY
Old Rocks
Diamond Member
- Thread starter
- #31
Ah Frankie boi, you remain such an endearing dumb fuck, no, -22 does not melt the ice, it just results in less ice forming than does -32.Well now, if that is the 2 meter anomaly map, yes, that is the case. That means that the normal temperature is - 32 C. Oh yes, Frankie boi, that map is in Celsius. Now Frankie boi, we know you cannot read simple prose, but you really need to practice reading simple maps.An area that -22F is red.
HmmKay
-22F is melting the ice.
Sure
Image 3 of 6 (play slideshow) Download
Arctic Sea Ice News and Analysis | Sea ice data updated daily with one-day lag
- May 20, 2009
- 144,498
- 66,892
- 2,330
The fucking joke is that the AGWCult thinks there'as a specific ideal "Normal" Temperature for the Arctic within a tenth of a degree, even within 5 degrees, and that there's a cataclysmic, catastrophic difference between -25F and -20F
It's just more monkeying with the numbers. First they add in the oceans temperature to skew the overall overall average and now they overweight and heavily skew the surface temperature in the Arctic to show these stupid "scary" pictures.
It's just more monkeying with the numbers. First they add in the oceans temperature to skew the overall overall average and now they overweight and heavily skew the surface temperature in the Arctic to show these stupid "scary" pictures.
- May 20, 2009
- 144,498
- 66,892
- 2,330
Argue with the real scientists, dear little ignoramous.
Guys who hide the decline and homogenize data are not real scientists. Not sure where you ever got that bizarre idea
The fucking joke is that the AGWCult thinks there'as a specific ideal "Normal" Temperature for the Arctic within a tenth of a degree,
No, that's entirely your kook fantasy.
even within 5 degrees, and that there's a cataclysmic, catastrophic difference between -25F and -20F
A constant 5F change is a massive difference, and will melt vast amounts of ice.
It's just more monkeying with the numbers. First they add in the oceans temperature to skew the overall overall average
So in your world, the oceans aren't part of the globe and shouldn't be included? You look to be advocating for data fudging by data omission. How can anyone take you seriously now?
and now they overweight and heavily skew the surface temperature in the Arctic to show these stupid "scary" pictures.
And your evidence for that is .... oh wait, you just made it up, same as you make up everything. You're a fraud machine.
Yeah.. This looks just like a crap-your-pants situation..

Difference from long-term median is less 1 Km2 in area.. Ready, Set, Dump....
Difference from long-term median is less 1 Km2 in area.. Ready, Set, Dump....
Old Rocks
Diamond Member
- Thread starter
- #37
Image 3 of 6 (play slideshow) Download
Arctic Sea Ice News and Analysis | Sea ice data updated daily with one-day lag
Way outside two standard deviations.
And there will be inevitable results.
Arctic Sea Ice News and Analysis | Sea ice data updated daily with one-day lag
Way outside two standard deviations.
And there will be inevitable results.

Five years ago Joe Romm and others were putting out this type of nonsense and Old Rocks couldn't get enough of it.
August September and October should already be ice free. No ice at all in the Arctic by 2035.
Just how irresponsible is it to foist a graph like this on the uneducated public?
Joe Romm is a MIT educated PhD physicist. He knows it is a physical impossibility for there to be no ice present in the Arctic night.
So why did he release this alarmist propaganda? If he is willing to lie about this, what other things is he willing to lie about?
Image 3 of 6 (play slideshow) Download
Arctic Sea Ice News and Analysis | Sea ice data updated daily with one-day lag
Way outside two standard deviations.
And there will be inevitable results.
Yeah --- WAAAY out by about 1Mill Km2.. Out of 13 or 14Mill Km2... Change your shorts and get a grip... MOST of all that area contains only 15% to 25% ice anyways... It's ICE CUBES bobbing in the sea. And winds/weather can DRIVE ALL that ice to compaction -- or spread it way the hell out..
KNOWLEDGE is cheaper than a pack of Depends.
Similar threads
- Replies
- 648
- Views
- 7K
- Replies
- 174
- Views
- 4K
- Replies
- 14
- Views
- 1K
Latest Discussions
- Replies
- 1
- Views
- 2
Forum List
-
-
-
-
-
Political Satire 8083
-
-
-
-
-
-
-
-
-
-
-
-
-
-
-
-
-
-
-
ObamaCare 781
-
-
-
-
-
-
-
-
-
-
-
Member Usernotes 471
-
-
-
-
-
-
-
-
-
-