AGW Scam Main Points

Here's what you need to bear in mind about the AGW scam

1. There is no such thing as an "Average Temperature" for a planet. All of the planets and Moons in our Solar System have a range of temperatures, the "Average" is a mathematical fiction. Don't believe me, pick a planet and look it up for yourself

2. There is no Experiment that demonstrates how a 120PPM increase in CO2 will raise temperature and lower ocean pH. Remember we are comparing an INSTANTANEOUS increase in a CLOSED system and there is still not one single experiment that shows how this works. Can you believe that even with a 120PPM instantaneous increase in a closed system, they still cannot produce one single experiment?

3. Human behavior simply cannot alter the climate of the planet; it's beyond arrogance, it's stupid.

4. The AGWCult has been caught with their thumb on the scale innumerable times. Their data is cooked, adjusted and outright faked.

5. When all else fails add in "Warming from the deep pacific ocean" to jack up the imaginary "Earth Average Temperature" Not only is there no average temperature, but the Scam continues only when they add in this ridiculous warming in the ocean 700m down. Yeah, we kept meticulous records of the deep Pacific ocean temperature these last 130 years. So this is a 1 no Average and 4 Data Massaging

6. Instead of acting like responsible scientist and welcome and demand their assumption be challenged, they yell DENIER!!! Michelson Morley could have set physics back 100 years by calling Einstein and other "ETHER DENIERS!!"

Anti-Smart-Meter-Bewegung: Widerstand gegen intelligente Stromzähler - SPIEGEL ONLINE
US-Bürger wehren sich gegen Stromzähler: Widerstand im Wohnwagen

image-732151-panoV9-sdge.jpg
I don`t have the time to translate the article. People like this guy sleep in their trailer instead of their house because the "smart meters" which US authorities are installing now, using force if necessary ding them with power bills in excess of $1000/month.
[ame="http://www.youtube.com/watch?v=jfki5FPDU9I&feature=youtu.be"]Energy Firm Caught Breaking Down Door to Install Smart Meter! - YouTube[/ame]
[ame="http://www.youtube.com/watch?v=i92-R6GgL3Y&feature=youtu.be"]Centerpoint Energy Smart Meter installation with police escort - YouTube[/ame]

It should get pretty interesting when they knock on the door of one of these "preppers" with an assault rifle
 
Last edited:
So what do you think of Frank's six points? Do you agree with any of them?
 
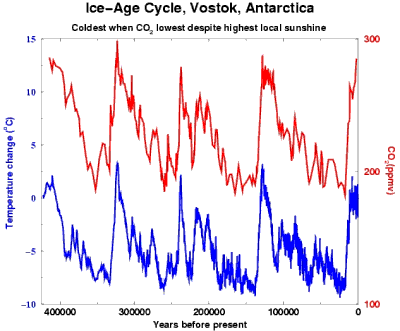
IceCores1.gif


Here's a 450,000 year long data set that totally destroys the AGWCult Theory

Notice what happens almost immediately after the CO2 spikes?

Look at 320,000 and 240,000 for example and draw your conclusions
 
The AGW mongers look at a 10 year time horizon and think the sky is falling.

As if.
 
IceCores1.gif


Here's a 450,000 year long data set that totally destroys the AGWCult Theory

Notice what happens almost immediately after the CO2 spikes?

Look at 320,000 and 240,000 for example and draw your conclusions

What is the source of that graph Frank?

As you may have noted, Old Rocks posted three different copies of the Vostok core data and the CO2 levels in each of them are significantly lower than your graph and theirs all match.

So where did you get yours Frank?
 
Last edited:
And, actually, as far as I can tell from that graph, the CO2 rises BEFORE the temperature does.

I think this is the same graph that's been posted here incorrectly labeled as showing global temperatures. I'm really curious as to your source.
 
Last edited:
I found a copy of your graph at Davies & Company but my site advisor software said the site contained malware.

I found another copy at www.johnosullivan.com (principia scientifica), a site famous for publishing lies.

Here are the same data from more reputable sites

air_bubbles_historical.jpg


vostok-ice-core.jpg


2380200-8067174453-t1cb9.gif


hansenFigure2.jpg


vostok.gif


CCC_Fig4_3_2.jpg


Google image search has hundreds of these graphs. With the exception of the one you've posted , they all agree that at no point in the Vostok record did CO2 levels ever exceed 300 ppm. Why is yours the exception Frank? Given that yours is the data that gives very strong appearance of having been manipulated - off being a lie - and that you have so far refused to identify the source of those data, what is your basis for accusing US of such behavior.
 
Last edited:
IceCores1.gif


Here's a 450,000 year long data set that totally destroys the AGWCult Theory

Notice what happens almost immediately after the CO2 spikes?

Look at 320,000 and 240,000 for example and draw your conclusions

What is the source of that graph Frank?

As you may have noted, Old Rocks posted three different copies of the Vostok core data and the CO2 levels in each of them are significantly lower than your graph and theirs all match.

So where did you get yours Frank?

The AGWCult massaged the data so it doesn't look like temperature collapses after CO2 spikes.

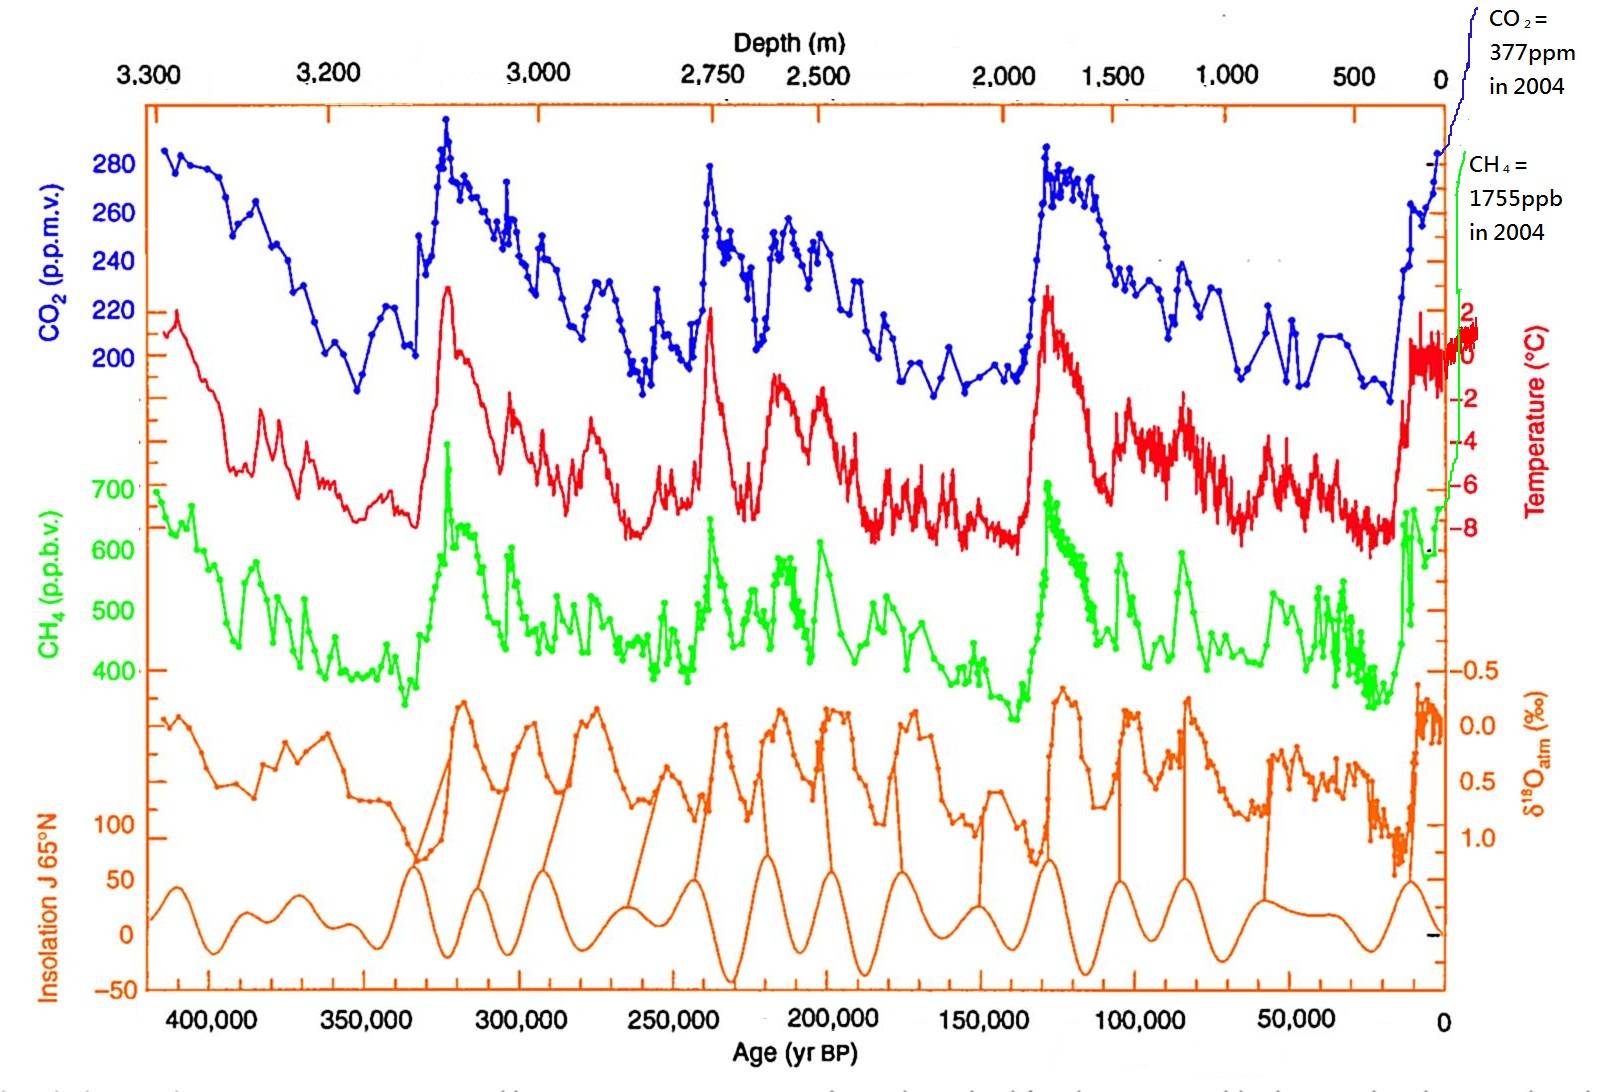
Vostok_420ky_4curves_insolation_to_2004.jpg


Antarctic Glaciers

CO2 spikes...temps collapse

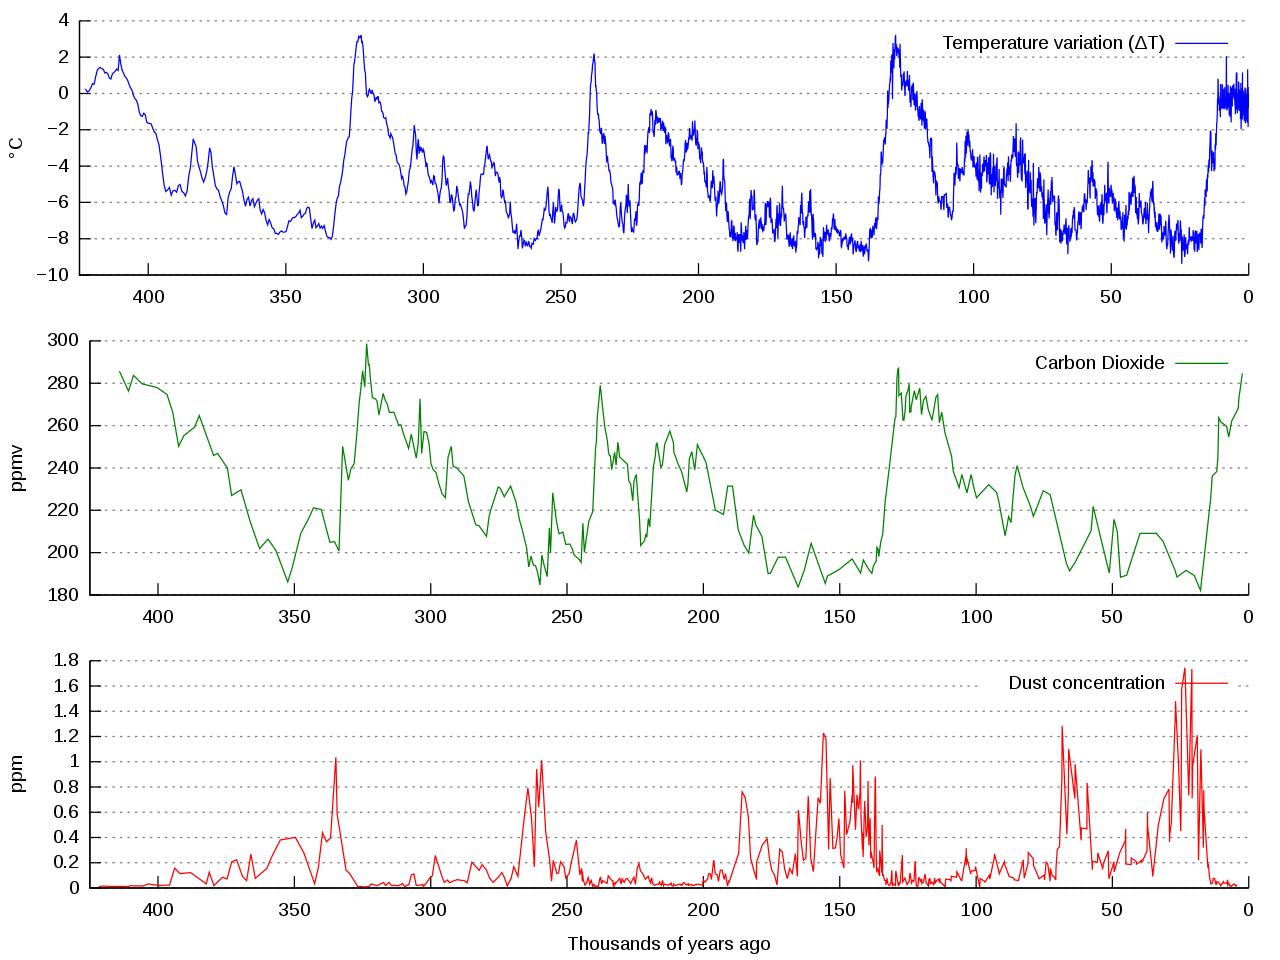
1280px-Vostok_Petit_data.svg.png


Wikipedia (Liberal Bible)

CO2 spikes...temps collapse
 
And, actually, as far as I can tell from that graph, the CO2 rises BEFORE the temperature does.

I think this is the same graph that's been posted here incorrectly labeled as showing global temperatures. I'm really curious as to your source.

Well your reading comprehension sucks because CO2 LAGS temperature on that chart
 
vostok-ice-core.jpg


Here's an Old Rocks chart.

What does it show?

Why it shows that large increases in CO2 do not cause increases in temperature. In fact, temperatures collapse after CO2 peaks.

How can that be?

What happened to CO2 being the Big Bully Climate Driver?

Not much of a driver
 
Hey, Frank, you fucking idiot: the point being made was that your Principia Scientific bullshit chart - after having first claimed that the Vostok cores presented global temperatures - claimed that it showed CO2 levels as high as 360 ppm when NONE of the world's actual experts on the topic saw any point in those records that broke 300.

And, if you'd like to show is at what point in the Vostok cores human combustion of fossil fuels doubled CO2 levels over a period of 150 years, and you can actually USE the core's data to make a point about the current situation, please point that out.

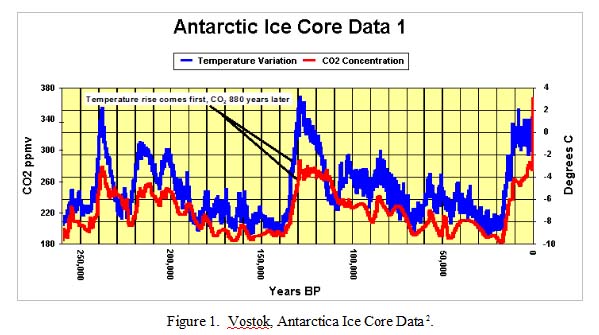
ps: I've noticed something. Let's look at the Vostok CO2 chart from Principia Scientific.org

vostok-ice-data.jpg


Look at the scale on the left side, where it pretends to show CO2 levels. Notice anything? It not fucking linear. The scale tick pattern doesn't match the data's grid pattern. The scale was modified or replaced from the original data. And you assholes have the nerve to accuse good scientists of fudging their numbers.
 
Last edited:
Hey, Frank, you fucking idiot: the point being made was that your Principia Scientific bullshit chart - after having first claimed that the Vostok cores presented global temperatures - claimed that it showed CO2 levels as high as 360 ppm when NONE of the world's actual experts on the topic saw any point in those records that broke 300.

And, if you'd like to show is at what point in the Vostok cores human combustion of fossil fuels doubled CO2 levels over a period of 150 years, and you can actually USE the core's data to make a point about the current situation, please point that out.

ps: I've noticed something. Let's look at the Vostok CO2 chart from Principia Scientific.org

vostok-ice-data.jpg


Look at the scale on the left side, where it pretends to show CO2 levels. Notice anything? It not fucking linear. The scale tick pattern doesn't match the data's grid pattern. The scale was modified or replaced from the original data. And you assholes have the nerve to accuse good scientists of fudging their numbers.


meh


nobody cares


CNN Boss Zucker: 'Tremendous' Lack of Interest in Our Climate Change Stories


CNN Boss Zucker: 'Tremendous' Lack of Interest in Our Climate Change Stories


Climate Change: Key Data Points from Pew Research | Pew Research Center


Climate Change Not a Top Worry in U.S.


deliberations on ice extents and good scientists are nothing more than an internet hobby.


Not to mention.......the top climate scientists choose to ignore critical data >>>

Climate alarmists ignore critical data - TheGazette


:Dwho's not winning?:D
 
Last edited:
Hey, Frank, you fucking idiot: the point being made was that your Principia Scientific bullshit chart - after having first claimed that the Vostok cores presented global temperatures - claimed that it showed CO2 levels as high as 360 ppm when NONE of the world's actual experts on the topic saw any point in those records that broke 300.

And, if you'd like to show is at what point in the Vostok cores human combustion of fossil fuels doubled CO2 levels over a period of 150 years, and you can actually USE the core's data to make a point about the current situation, please point that out.

ps: I've noticed something. Let's look at the Vostok CO2 chart from Principia Scientific.org

vostok-ice-data.jpg


Look at the scale on the left side, where it pretends to show CO2 levels. Notice anything? It not fucking linear. The scale tick pattern doesn't match the data's grid pattern. The scale was modified or replaced from the original data. And you assholes have the nerve to accuse good scientists of fudging their numbers.

meh

nobody cares


Then why do ALL your buddies bet their last bottom dollar on the charge that it is the climate scientists who are being dishonest?

And so good to see your high moral standards, you stupid, bigoted asshole.
 
Hey, Frank, you fucking idiot: the point being made was that your Principia Scientific bullshit chart - after having first claimed that the Vostok cores presented global temperatures - claimed that it showed CO2 levels as high as 360 ppm when NONE of the world's actual experts on the topic saw any point in those records that broke 300.

And, if you'd like to show is at what point in the Vostok cores human combustion of fossil fuels doubled CO2 levels over a period of 150 years, and you can actually USE the core's data to make a point about the current situation, please point that out.

ps: I've noticed something. Let's look at the Vostok CO2 chart from Principia Scientific.org

vostok-ice-data.jpg


Look at the scale on the left side, where it pretends to show CO2 levels. Notice anything? It not fucking linear. The scale tick pattern doesn't match the data's grid pattern. The scale was modified or replaced from the original data. And you assholes have the nerve to accuse good scientists of fudging their numbers.

The source of the CO2 is irrelevant because no matter how to try to parse it; CO2 does not drive climate. It spikes and temperatures collapse.
 
Hey, Frank, you fucking idiot: the point being made was that your Principia Scientific bullshit chart - after having first claimed that the Vostok cores presented global temperatures - claimed that it showed CO2 levels as high as 360 ppm when NONE of the world's actual experts on the topic saw any point in those records that broke 300.

And, if you'd like to show is at what point in the Vostok cores human combustion of fossil fuels doubled CO2 levels over a period of 150 years, and you can actually USE the core's data to make a point about the current situation, please point that out.

ps: I've noticed something. Let's look at the Vostok CO2 chart from Principia Scientific.org

vostok-ice-data.jpg


Look at the scale on the left side, where it pretends to show CO2 levels. Notice anything? It not fucking linear. The scale tick pattern doesn't match the data's grid pattern. The scale was modified or replaced from the original data. And you assholes have the nerve to accuse good scientists of fudging their numbers.

Find the pattern (Crick has trouble with math)

180, 220, 260, 300, 340, 380

"Look at the scale on the left side, where it pretends to show CO2 levels. Notice anything? It not fucking linear."
 
Last edited:
Find the pattern (Crick has trouble with math)

180, 220, 260, 300, 340, 380

"Look at the scale on the left side, where it pretends to show CO2 levels. Notice anything? It not fucking linear."

Crick don't do math.....or charts. And yet, he claims to be an ocean engineer.
 

Forum List

Back
Top