Why isn't the heat from using electricity included in earth's energy budget?

Why isn't the heat from using electricity included in earth's energy budget?

  • Because I was told to ignore it by my climate gods

    Votes: 0 0.0%
  • Because I don't want to give up electricity too

    Votes: 0 0.0%
  • Because it's such a small amount it doesn't matter

    Votes: 0 0.0%

  • Total voters
    7
This is really simple. Don't use urban heat stations.

Do you like apples? I like apples.

I found a list of the 123 most populated cities. The total population if those 123 cities is
1,050,748,000 people or roughly 1/7 of the world's population. The surface are of those 123 cities which contains 1/7 of the people on earth is 214,468 km^2 or 2.14468E+11 m^2.

The world wide average continuous heat flow from the use of electricity is 18 tW. So the waste heat of the 1,050,748,000 people living in those 123 cities would be 1/7 of that or 2.5714 tW or 2.5714+12 W. So the radiative forcing from waste heat from electricity usage in the most populated cities is equal to 2.5714+12 W divided by 2.14468E+11 m^2 which is equal to 11.99 W/m^2.

How about dem apples?

I've already responded to the urban heat island and effect of station sitings which show that poor station siting and urban heat islands do not result in a statistically significant difference in the data.
 
You made the claim that the IPCC tunes model to make it look like there's warming when there isn't warming or to make it look like it is due to CO2 when they know it is not.

None of these claims are so far supported other than your claim that they do those things.

I will note that:

1. The IPCC doesn't make ANY models
2. The IPCC NEVER said that all warming is due only to CO2
3. No scientist ever said all warming was due only to CO2
4. The tuning of the models is done to make them comport with the observed climate


You need to support your claim of their wrongdoing.
:lol:

"...The most important thing to remember about climate models which are used to project future global warming is that they were “tuned” with the assumption I started this article with: that the climate system is in a natural state of energy balance, and that there is no long-term climate change unless humans cause it.

This is an arbitrary and illogical assumption. The climate system is an example of a “nonlinear dynamical system”, which means it can change all by itself. For example, slow changes in the rate of vertical overturning of the world’s oceans can cause global warming (or global cooling) with no “external forcing” of the climate system whatsoever.

Instead, the climate models are “tuned” to not produce natural climate change. If a 100-year run of the model produces change, the model is adjusted to removed the “drift”. The models do not produce global energy balance from “first physical principles”, because none of the processes controlling that balance are known to sufficient accuracy. Instead, the models are “fudged” to produce energy balance, based upon the modelers’ assumption of no natural climate change. Then, the models are used as “proof” that only increasing CO2 has caused recent warming.

This is circular reasoning..."


I've already responded to the urban heat island and effect of station sitings which show that poor station siting and urban heat islands do not result in a statistically significant difference in the data.
The average radiative forcing from waste heat from electricity usage in the 123 most populated cities is equal to 11.99 W/m^2.
 
You should cite the paper in the proper way: Ronan Connolly et al 2021 Res. Astron. Astrophys. 21 131

Ronan Connolly1,2 , Willie Soon1 , Michael Connolly2 , Sallie Baliunas3 , Johan Berglund4 , C. John Butler5 , Rodolfo Gustavo Cionco6,7 , Ana G. Elias8,9 , Valery M. Fedorov10, Hermann Harde11, Gregory W. Henry12, Douglas V. Hoyt13, Ole Humlum14, David R. Legates15, Sebastian Luning ¨ 16, Nicola Scafetta17, Jan-Erik Solheim18, Laszl ´ o Szarka ´ 19, Harry van Loon20, V´ıctor M. Velasco Herrera21, Richard C. Willson22, Hong Yan (y˜) 23 and Weijia Zhang24,25

1 Center for Environmental Research and Earth Science (CERES), Salem, MA 01970, USA; [email protected]
2 Independent scientists, Dublin, Ireland
3 Retired, formerly Harvard-Smithsonian Center for Astrophysics, Cambridge, MA 02138, USA
4 Independent researcher, Malmo, Sweden ¨
5 Retired, formerly Armagh Observatory, College Hill, Armagh BT61 9DG, Northern Ireland, UK
6 Comision de Investigaciones Cient ´ ´ıficas de la Provincia de Buenos Aires, Argentina
7 Grupo de Estudios Ambientales, Universidad Tecnologica Nacional, Coløn 332, San Nicol ´ as (2900), Buenos Aires, Argentina ´
8 Laboratorio de F´ısica de la Atmosfera, Facultad de Ciencias Exactas y Tecnolog ´ ´ıa, Universidad Nacional de Tucuman, Av. ´ Independencia 1800, 4000 Tucuman, Argentina ´
9 Instituto de F´ısica del Noroeste Argentino (Consejo Nacional de Investigaciones Cientficas y Tecnicas - Universidad Nacional de ´ Tucuman), 4000 Tucum ´ an, Argentina ´
10 Faculty of Geography, Lomonosov, Moscow State University, Leninskie Gory St. 1, Moscow 119991, Russia
11 Helmut-Schmidt-University, Hamburg, Germany
12 Center of Excellence in Information Systems, Tennessee State University, Nashville, TN 37209 USA
13 Independent scientist, Berkeley Springs, WV, USA
14 Emeritus Professor in Physical Geography, Department of Geosciences, University of Oslo, Norway
15 College of Earth, Ocean, and the Environment, University of Delaware, Newark DE 19716-2541, USA
16 Institute for Hydrography, Geoecology and Climate Sciences, Hauptstraβe 47, 6315 Ageri, Switzerland ¨
17 Department of Earth Sciences, Environment and Georesources, University of Naples Federico II, Complesso Universitario di Monte S. Angelo, via Cinthia, 21, 80126 Naples, Italy
18 Retired, formerly Department of Physics and Technology, UiT The Arctic University of Norway, 9037 Tromsø, Norway
19 ELKH Institute of Earth Physics and Space Science, 9400 Sopron, Csatkai utca 6-8, Hungary
20 Retired, formerly National Center for Atmospheric Research, Boulder, Colorado, USA
21 Instituto de Geofisica, Universidad Nacional Autonoma de M ´ exico, Ciudad Universitaria, Coyoac ´ an, 04510, M ´ exico D.F., M ´ exico ´
22 Active Cavity Radiometer Irradiance Monitor (ACRIM), Coronado, CA 92118, USA
23 State Key Laboratory of Loess and Quaternary Geology, Institute of Earth Environment, Chinese Academy of Sciences, Xi’an 710061, China
24 Department of Mathematics and Physics, Shaoxing University, Shaoxing, China
25 Department of AOP Physics, University of Oxford, Oxford, UK
It's interesting how many of these people are retired, how many of them are "independent scientists" and how many do not actually indicate what their academic speciality might be. Mr Legates, for instance, has no training whatsoever in the sun or the atmosphere or thermodynamics or even basic physics. And that IS an awful lot of co-authors. As to the heat produced by the consumption of electricity: we know the total. Why don't we simply compare that to the total in your initial diagram which you insist doesn't include it - though you don't tell us how you know that.

Your diagram gives us 398.2 Wm-2. The Earth has a surface area of 5.099686589e+14 m^2. So the total radiated by the surface is 203,069,519,973,980,000 or 203 petawatts. There are 8,760 hours in one year so annual radiated power is 1,778,888,994,972,064,800,000 or 1.779 zettawatt hours Total global electrical consumption in 2020 was 22.200 Petawatt hours. Assuming every watt of electricity used eventually gets turned into heat (which is not correct; quite a bit ends up as potential energy from having lifted things), that would represent 0.0000125 or one and one quarter part in one hundred thousand of that produced by solar radiation. I certainly could have misplaced a decimal point somewhere along the line there - feel free to check - but it looks as if the heat produced by our consumption of electricity is absolutely trivial in any discussion of global warming.
So you are conceding that the IPCC models include urban temperature station data and use the low variability solar output dataset?
 
It's interesting how many of these people are retired, how many of them are "independent scientists" and how many do not actually indicate what their academic speciality might be. Mr Legates, for instance, has no training whatsoever in the sun or the atmosphere or thermodynamics or even basic physics. And that IS an awful lot of co-authors. As to the heat produced by the consumption of electricity: we know the total. Why don't we simply compare that to the total in your initial diagram which you insist doesn't include it - though you don't tell us how you know that.

Your diagram gives us 398.2 Wm-2. The Earth has a surface area of 5.099686589e+14 m^2. So the total radiated by the surface is 203,069,519,973,980,000 or 203 petawatts. There are 8,760 hours in one year so annual radiated power is 1,778,888,994,972,064,800,000 or 1.779 zettawatt hours Total global electrical consumption in 2020 was 22.200 Petawatt hours. Assuming every watt of electricity used eventually gets turned into heat (which is not correct; quite a bit ends up as potential energy from having lifted things), that would represent 0.0000125 or one and one quarter part in one hundred thousand of that produced by solar radiation. I certainly could have misplaced a decimal point somewhere along the line there - feel free to check - but it looks as if the heat produced by our consumption of electricity is absolutely trivial in any discussion of global warming.
You need to look at the concentrated areas of waste heat, bro. It ain't trivial. It's 11.99 W/m^2.

Which is why urban temperature stations shouldn't be used to estimate the effects of CO2 which is 5 times less in radiative forcing.
 
You need to look at the concentrated areas of waste heat, bro. It ain't trivial. It's 11.99 W/m^2.

Which is why urban temperature stations shouldn't be used to estimate the effects of CO2 which is 5 times less in radiative forcing.
So, as CC asked, do you have something with which to refute Peterson? And if you're concentrated spots are 12 Wm-2 when the planet as a whole is radiating almost 400 Wm-2, then, yes, it IS trivial.
 
The average radiative forcing from waste heat from electricity usage in the 123 most populated cities is equal to 11.99 W/m^2.

Then you should have not trouble finding a statistically significant difference between the USHCN data with and without urban settings or heat-inducing sitings.

I think you can achieve it with just a simple t-test since you'll be comparing two means. I'd settle for a p-value of 0.05 for significance. But you might be able to open that up a bit with a good bit of explanation. OR if you find that the two data sets do not have a normal distribution there are nonparametric means of comparing the modes.

Thanks!
 
Your diagram gives us 398.2 Wm-2. The Earth has a surface area of 5.099686589e+14 m^2. So the total radiated by the surface is 203,069,519,973,980,000 or 203 petawatts. There are 8,760 hours in one year so annual radiated power is 1,778,888,994,972,064,800,000 or 1.779 zettawatt hours Total global electrical consumption in 2020 was 22.200 Petawatt hours. Assuming every watt of electricity used eventually gets turned into heat (which is not correct; quite a bit ends up as potential energy from having lifted things), that would represent 0.0000125 or one and one quarter part in one hundred thousand of that produced by solar radiation. I certainly could have misplaced a decimal point somewhere along the line there - feel free to check - but it looks as if the heat produced by our consumption of electricity is absolutely trivial in any discussion of global warming.
Yeah, you messed up. Not sure where.

Human production of energy is even lower at an estimated 160,000 TW-hr for all of year 2019. This corresponds to an average continuous heat flow of about 18 TW.[14] However, consumption is growing rapidly and energy production with fossil fuels also produces an increase in atmospheric greenhouse gases, leading to a more than 20 times larger imbalance in the incoming/outgoing flows that originate from solar radiation.[15]

Which when 18 tW is divided by the surface area of the planet it isn't much. But when it's looked at through the lens of populous cities it's quite a large forcing. Between electricity use and albedo changes due to concrete jungles, temperature readings fro urban stations have a very large urban heat island radiative forcing component of 11.99 W/m^2.
 
Last edited:
So, as CC asked, do you have something with which to refute Peterson? And if you're concentrated spots are 12 Wm-2 when the planet as a whole is radiating almost 400 Wm-2, then, yes, it IS trivial.
You mean besides the side by side comparison of datasets with and without urban readings and the radiative forcing of 11.99 W/m^2 due to waste energy from electricity usage?
 
Then you should have not trouble finding a statistically significant difference between the USHCN data with and without urban settings or heat-inducing sitings.

I think you can achieve it with just a simple t-test since you'll be comparing two means. I'd settle for a p-value of 0.05 for significance. But you might be able to open that up a bit with a good bit of explanation. OR if you find that the two data sets do not have a normal distribution there are nonparametric means of comparing the modes.

Thanks!
It's pretty amazing how you dismiss 11.99 W/m^2 of radiative forcing from waste heat from electricity use in the most populous cities.
 
RankUrban AreaPopulation Estimate
(2015)
CountryLand Area: Km2Density
1​
Tokyo-Yokohama
37,843,000​
Japan
8,547​
4,400​
2​
Jakarta
30,539,000​
Indonesia
3,225​
9,500​
3​
Delhi, DL-UP-HR
24,998,000​
India
2,072​
12,100​
4​
Manila
24,123,000​
Philippines
1,580​
15,300​
5​
Seoul-Incheon
23,480,000​
South Korea
2,266​
10,400​
6​
Shanghai, SHG-JS-ZJ
23,416,000​
China
3,820​
6,100​
7​
Karachi
22,123,000​
Pakistan
945​
23,400​
8​
Beijing, BJ
21,009,000​
China
3,820​
5,500​
9​
New York, NY-NJ-CT
20,630,000​
United States
11,642​
1,800​
10​
Guangzhou-Foshan, GD
20,597,000​
China
3,432​
6,000​
11​
Sao Paulo
20,365,000​
Brazil
2,707​
7,500​
12​
Mexico City
20,063,000​
Mexico
2,072​
9,700​
13​
Mumbai, MH
17,712,000​
India
546​
32,400​
14​
Osaka-Kobe-Kyoto
17,444,000​
Japan
3,212​
5,400​
15​
Moscow
16,170,000​
Russia
4,662​
3,500​
16​
Dhaka
15,669,000​
Bangladesh
360​
43,500​
17​
Cairo
15,600,000​
Egypt
1,761​
8,900​
18​
Los Angeles, CA
15,058,000​
United States
6,299​
2,400​
19​
Bangkok
14,998,000​
Thailand
2,590​
5,800​
20​
Kolkata, WB
14,667,000​
India
1,204​
12,200​
21​
Buenos Aires
14,122,000​
Argentina
2,681​
5,300​
22​
Tehran
13,532,000​
Iran
1,489​
9,100​
23​
Istanbul
13,287,000​
Turkey
1,360​
9,800​
24​
Lagos
13,123,000​
Nigeria
907​
14,500​
25​
Shenzhen, GD
12,084,000​
China
1,748​
6,900​
26​
Rio de Janeiro
11,727,000​
Brazil
2,020​
5,800​
27​
Kinshasa
11,587,000​
Congo (Dem. Rep.)
583​
19,900​
28​
Tianjin, TJ
10,920,000​
China
2,007​
5,400​
29​
Paris
10,858,000​
France
2,845​
3,800​
30​
Lima
10,750,000​
Peru
919​
11,700​
31​
Chengdu, SC
10,376,000​
China
1,541​
6,700​
32​
London
10,236,000​
United Kingdom
1,738​
5,900​
33​
Nagoya
10,177,000​
Japan
3,885​
2,600​
34​
Lahore
10,052,000​
Pakistan
790​
12,700​
35​
Bangalore, KA
9,807,000​
India
1,166​
8,400​
36​
Chennai, TN
9,714,000​
India
971​
10,000​
37​
Chicago, IL-IN-WI
9,156,000​
United States
6,856​
1,300​
38​
Bogota
8,991,000​
Colombia
492​
18,300​
39​
Ho Chi Minh City
8,957,000​
Vietnam
1,489​
6,000​
40​
Hyderabad, AP
8,754,000​
India
1,230​
7,100​
41​
Dongguan, GD
8,442,000​
China
1,619​
5,200​
42​
Johannesburg-East Rand
8,432,000​
South Africa
2,590​
3,300​
43​
Wuhan, HUB
7,509,000​
China
1,166​
6,400​
44​
Taipei
7,438,000​
China: Taiwan
1,140​
6,500​
45​
Hangzhou, ZJ
7,275,000​
China
1,217​
6,000​
46​
Hong Kong
7,246,000​
China: Hong Kong SAR
275​
26,400​
47​
Chongqing, CQ
7,217,000​
China
932​
7,700​
48​
Ahmadabad, GJ
7,186,000​
India
350​
20,600​
49​
Kuala Lumpur
7,088,000​
Malaysia
1,943​
3,600​
50​
Quanzhou, FJ
6,710,000​
China
1,528​
4,400​
51​
Essen-Dusseldorf
6,679,000​
Germany
2,655​
2,500​
52​
Baghdad
6,625,000​
Iraq
673​
9,800​
53​
Toronto, ON
6,456,000​
Canada
2,287​
2,800​
54​
Santiago
6,225,000​
Chile
984​
6,300​
55​
Dallas-Fort Worth, TX
6,174,000​
United States
5,175​
1,200​
56​
Madrid
6,171,000​
Spain
1,321​
4,700​
57​
Nanjing, JS
6,155,000​
China
1,269​
4,800​
58​
Shenyang, LN
6,078,000​
China
1,010​
6,000​
59​
Xi'an, SAA
5,977,000​
China
932​
6,400​
60​
San Francisco-San Jose, CA
5,929,000​
United States
2,797​
2,100​
61​
Luanda
5,899,000​
Angola
894​
6,600​
62​
Qingdao, SD
5,816,000​
China
1,489​
3,900​
63​
Houston, TX
5,764,000​
United States
4,644​
1,200​
63​
Miami, FL
5,764,000​
United States
3,209​
1,800​
65​
Bandung
5,695,000​
Indonesia
466​
12,200​
66​
Riyadh
5,666,000​
Saudi Arabia
1,502​
3,800​
67​
Pune, MH
5,631,000​
India
479​
11,800​
68​
Singapore
5,624,000​
Singapore
518​
10,900​
69​
Philadelphia, PA-NJ-DE-MD
5,570,000​
United States
5,131​
1,100​
70​
Surat, GJ
5,447,000​
India
233​
23,400​
71​
Milan
5,257,000​
Italy
1,891​
2,800​
72​
Suzhou, JS
5,246,000​
China
1,127​
4,700​
73​
St. Petersburg
5,126,000​
Russia
1,347​
3,800​
74​
Khartoum
5,125,000​
Sudan
932​
5,500​
75​
Atlanta, GA
5,015,000​
United States
6,851​
700​
76​
Zhengzhou, HEN
4,942,000​
China
829​
6,000​
77​
Washington, DC-VA-MD
4,889,000​
United States
3,424​
1,400​
78​
Surabaya
4,881,000​
Indonesia
673​
7,200​
79​
Harbin, HL
4,815,000​
China
570​
8,500​
80​
Abidjan
4,800,000​
Ivory Coast
324​
14,800​
80​
Yangon
4,800,000​
Myanmar
544​
8,800​
82​
Nairobi
4,738,000​
Kenya
557​
8,500​
83​
Barcelona
4,693,000​
Spain
1,075​
4,400​
84​
Alexandria
4,689,000​
Egypt
293​
16,000​
85​
Kabul
4,635,000​
Afghanistan
259​
17,900​
86​
Guadalajara
4,603,000​
Mexico
751​
6,100​
87​
Ankara
4,538,000​
Turkey
660​
6,900​
88​
Belo Horizonte
4,517,000​
Brazil
1,088​
4,200​
89​
Boston, MA-NH-RI
4,478,000​
United States
5,325​
800​
90​
Xiamen, FJ
4,420,000​
China
583​
7,600​
91​
Kuwait
4,283,000​
Kuwait
712​
6,000​
92​
Dar es Salaam
4,219,000​
Tanzania
570​
7,400​
93​
Phoenix, AZ
4,194,000​
United States
3,196​
1,300​
94​
Dalian, LN
4,183,000​
China
777​
5,400​
95​
Accra
4,145,000​
Ghana
971​
4,300​
96​
Monterrey
4,083,000​
Mexico
894​
4,600​
97​
Berlin
4,069,000​
Germany
1,347​
3,000​
98​
Sydney, NSW
4,036,000​
Australia
2,037​
2,000​
99​
Fuzhou, FJ
3,962,000​
China
440​
9,000​
100​
Medan
3,942,000​
Indonesia
479​
8,200​
101​
Dubai
3,933,000​
United Arab Emirates
1,347​
2,900​
102​
Melbourne, VIC
3,906,000​
Australia
2,543​
1,500​
102​
Rome
3,906,000​
Italy
1,114​
3,500​
102​
Busan
3,906,000​
South Korea
401​
9,700​
105​
Cape Town
3,812,000​
South Africa
816​
4,700​
106​
Jinan, SD
3,789,000​
China
725​
5,200​
107​
Ningbo, ZJ
3,753,000​
China
738​
5,100​
108​
Hanoi
3,715,000​
Vietnam
466​
8,000​
109​
Naples
3,706,000​
Italy
1,023​
3,600​
110​
Taiyuan, SAX
3,702,000​
China
518​
7,100​
111​
Jiddah
3,677,000​
Saudi Arabia
842​
4,400​
112​
Detroit, MI
3,672,000​
United States
3,463​
1,100​
113​
Hefei, AH
3,665,000​
China
725​
5,100​
114​
Changsha, HUN
3,657,000​
China
622​
5,900​
115​
Kunming, YN
3,649,000​
China
712​
5,100​
116​
Wuxi, JS
3,597,000​
China
738​
4,900​
117​
Medellín
3,568,000​
Colombia
228​
15,700​
118​
Faisalabad
3,560,000​
Pakistan
181​
19,600​
118​
Aleppo
3,560,000​
Syria
259​
13,700​
120​
Kano
3,550,000​
Nigeria
251​
14,100​
121​
Montréal, QC
3,536,000​
Canada
1,546​
2,300​
122​
Dakar
3,520,000​
Senegal
194​
18,100​
123​
Athens
3,484,000​
Greece
583​
6,000​
1,050,748,000​
people
214,468​
km^2

 
Last edited:
All electricity used to perform work eventually becomes waste heat.

Maybe you could provide a better chart then. :)

HeatRedist.png
 
It's pretty amazing how you dismiss 11.99 W/m^2 of radiative forcing from waste heat from electricity use in the most populous cities.

I'm not dismissing it. I'm pointing out the fact that no one seems to feel that it is a significant factor. The things you claim are not things that most professionals in the field think are real.

You demand I address every data point you throw out but you NEVER address ANY point I throw out.

You demand I address Soon. But you won't say ANYTHING about Peterson.

Here's a great question to ask yourself from time to time: "Hey, I just realized I'm not a professional climate scientist! But I think I've found something that ALL THE WORLD'S EXPERTS OVER THE LAST 60 YEARS OF INTENSIVE STUDY have missed! Am I more likely right or am I more likely wrong?"

Given that you are not actively pursuing any RESEARCH in this area it comes down to a "probabilities" game.

And the good money says you are more likely wrong.

I'm not saying for sure you ARE wrong, just that given what we are presented with here, you are more likely wrong.

This is a good gut check for any scientist when they step out of their comfort zone.
 
Yeah, you messed up. Not sure where.

Human production of energy is even lower at an estimated 160,000 TW-hr for all of year 2019. This corresponds to an average continuous heat flow of about 18 TW.[14] However, consumption is growing rapidly and energy production with fossil fuels also produces an increase in atmospheric greenhouse gases, leading to a more than 20 times larger imbalance in the incoming/outgoing flows that originate from solar radiation.[15]

Which when 18 tW is divided by the surface area of the planet it isn't much. But when it's looked at through the lens of populous cities it's quite a large forcing. Between electricity use and albedo changes due to concrete jungles, temperature readings fro urban stations have a very large urban heat island radiative forcing component of 11.99 W/m^2.
You've got yourself turned around. AFTER you find out I messed up somewhere, you can say so. If you don't know where I messed up, you DON'T KNOW that I messed up.

And your spiel there is an absolutely perfect example of someone looking for a specific outcome before they have any idea whether or not such an outcome exists. Concentrating an effect into small areas may make it look really impressive in those small areas but it DOESN'T increase the total effect AT ALL.
 
Incorrect.

First: the IPCC doesn't make ANY models. They utilize the models from the literature.

Second: This is not even close to how these models are generated. Yes, there is parameter tuning for those parts of the sub-models that lack a single suite of physical equations (the empirical descriptors) which often require tuning to fit the data and create an equation for the model.

Don't believe me? Why not listen to more experts in climate:

"Tuning consists of adjusting the values of these parameters to bring the solution as a whole into line with aspects of the observed climate. " (SOURCE)


You should already be more than familiar with modeling in the sciences given your background.
Wow. They admit they alter data to fit their already-arrived-at conclusion, and you defend it as science.

Hint: It's not.
 
They don't admit anything like that.

Or you would be able to show me that.

But you can't and you won't.
I bet you believed their nonsense when they said the Climategate emails didn't say they altered data when the emails clearly showed they altered data.

CLIMATE MODEL PROBLEMS PERSIST, CHANGES REDUCE ACCURACY FURTHER


Scientists Conclude Dire Climate Change Models Were Wrong, Now What?


New Confirmation that Climate Models Overstate Atmospheric Warming


Global Warming: Another Doomsday Climate Model Flunks A Math Test

The United Nations Intergovernmental Panel on Climate Change (IPCC), which has issued a number of alarming reports on global warming over the years, has used literally dozens of different models to confirm their dire forecasts. The models are different in some respects, but all share one big problem in common: They can't even accurately predict what has already happened, much less forecast what will happen in the deep future.

Media Negligence​

Scientists know this, but the media mostly ignore it.

"(Climate models) are full of fudge factors that are fitted to the existing climate, so the models more or less agree with the observed data," wrote Nobel Prize-winning physicist Freeman Dyson. "But there is no reason to believe that the same fudge factors would give the right behaviour in a world with different chemistry, for example in a world with increased CO2 in the atmosphere."

A study by Lewis and climate scientist Judith Curry in the American Meteorological Society's journal estimated that a doubling of carbon dioxide in the atmosphere would result in temperatures of anywhere from 30% to 45% below UN estimates. In other words, no global warming crisis exists.

Scientists try to explain why climate models can’t reproduce the early-2000s global warming slowdown

Looks like the models are crap, doesn't it?
 
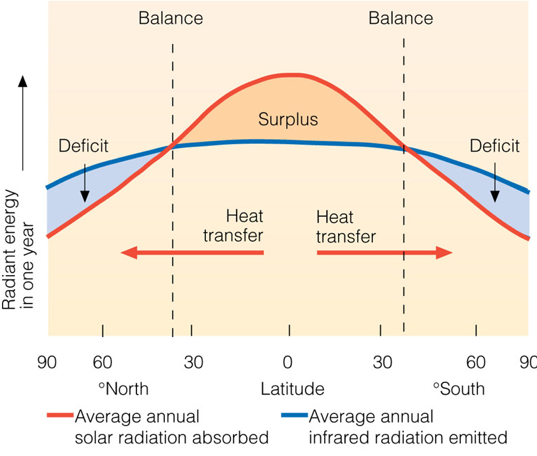
Anyone ever look closely at Earth's energy budget. I mean really close. Close enough that you know how all the numbers add up? If you haven't, go ahead and do that now because I have a question.

View attachment 650708

Why isn't the heat from using electricity included in earth's energy budget?
When the models over estimate warming by a factor of ten, at minimum, you must look for what else is influencing the system. IF they include heat generated from power generation it shows CO2 to be much less of an influence and they simply can't have that.
 

Forum List

Back
Top