Lifespan of 47.
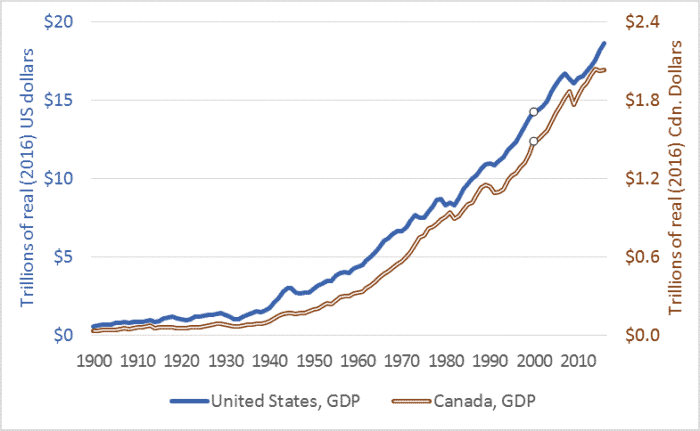
Adjusted GDP of $.59 Tr vs. $14.3 Tr in 2000.
This graph shows the increasing sizes of the US and Canadian economies. The graph plots US Gross Domestic Product (GDP) on the left-hand axis, and Canadian GDP on the right. The time-frame is 1900 to 2016. The year 2000 is marked with an open circle, to highlight the 20th century. The units are...

www.darrinqualman.com
In the middle of the bloody Phillipine - American
Guerilla war
Involved in the Boxer Rebellion
Plague in California
What exactly was great about it?
We are great now and have the opportunity to become even better.