RhodyPatriot
Diamond Member
- Aug 28, 2022
- 23,378
- 32,450
- 2,288
Oh.
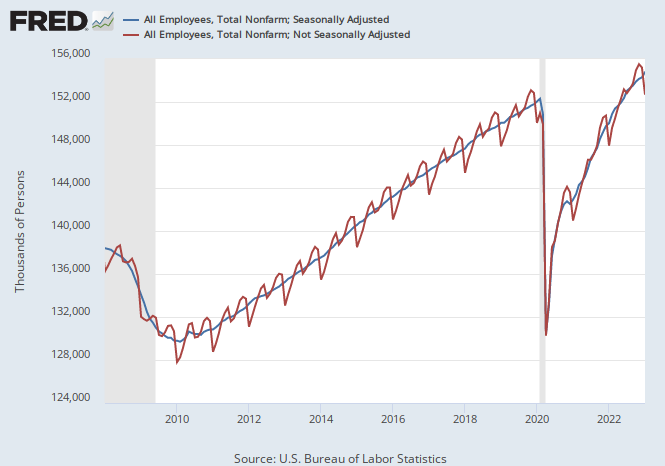
Via Rich Dvorak: “The Not Seasonally Adjusted print for monthly change in Nonfarm Payrolls was -2.5 million jobs. That means the headline +517K employment gain reported in January was driven entirely by a +3 million seasonal adjustment.”

 survivalmagazine.org
How very interesting.
Via Rich Dvorak: “The Not Seasonally Adjusted print for monthly change in Nonfarm Payrolls was -2.5 million jobs. That means the headline +517K employment gain reported in January was driven entirely by a +3 million seasonal adjustment.”
US Economy Actually Lost 2.5 Million Jobs in January – Reported as a “Gain” of 517,000
The mainstream media cheered the news that the U.S. economy added 517,000 jobs last month. Sadly, that just isn’t true. According to reports and the St. Louis
survivalmagazine.org
How very interesting.
Last edited: