protectionist
Diamond Member
- Oct 20, 2013
- 62,037
- 22,064
- 2,250
Every time I look at the BEA GDP chart (in Trading Economics > United States GDP Growth Rate | 2019 | Data | Chart | Calendar | Forecast ...they're showing something different. I guess we can start calling it the BEA Chart Of the Month.LIAR!
Quote the BEA saying that lie, or STFU!!!!!
It was Tramp who just got caught cooking the numbers so you worthless lying scum CON$ervoFascists have to accuse Obama of what Tramp is doing to muddy the waters!
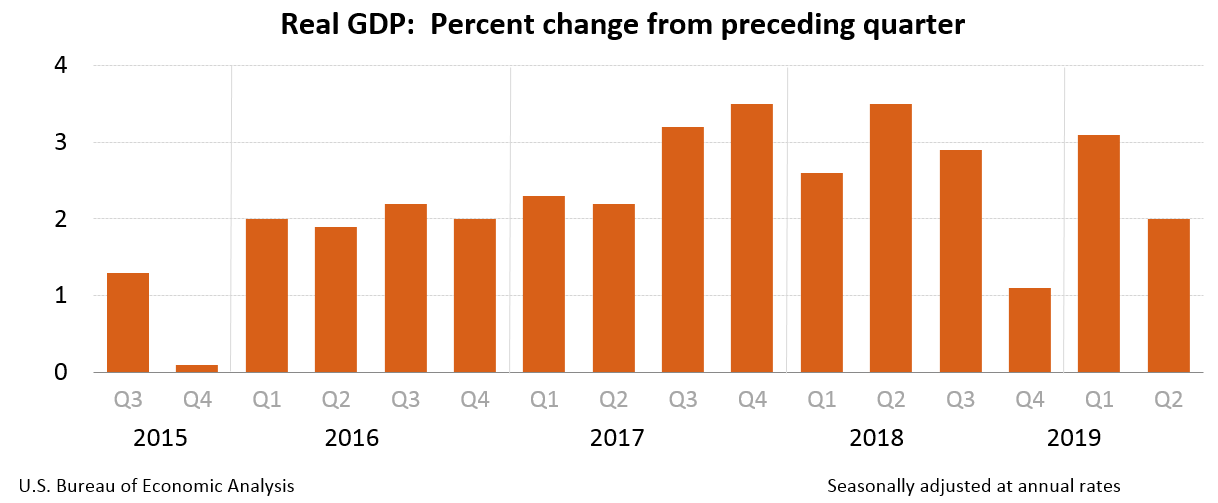
Now they're showing Obama's actually receding 2016 GDP as a rather stable 2...1.9...2.2...2

Nothing could be further from the truth. I posted their GDP chart quite a number of times in 2017, 2018, 2019. Up until about a month or 2 ago, the numbers were 1.5...2.3....0.8....0.8. Then they changed that to 2.3...1.9....1.8....1.8.
Then, somebody didnt like the looks of the dropping (REAL) numbers, so they started flattening them out, to try to make Obama look like he had control of things.
Oh yeah, right. They also slashed Trump's GDP's, cutting his 4.2% in 2nd quarter of 2018, down to 3.5, and next quarter down to 2.9. They're probably fooling a few people, here and there. Others are wise to this.
What really irks me is that MY NUMBERS that I POSTED have been changed, and new numbers that I did not post, are now showing as if I had posted those fake numbers. I should ask USMB to remove those posts. Nothing posted in USMB should be changed, to show something other than the original posting.
Here's the original BEA posting (posted by © Statista 2019) to keep the record honest (before we started getting close to the 2020 election, and Democrat desperation started sinking in) >>
© Statista 2019