healthmyths
Diamond Member
- Sep 19, 2011
- 30,375
- 11,954
- 1,400
- Thread starter
- #21
In summary the global warming evangelistas have YET to explain why the extreme range of CO2 emissions from 1750 to 2012.
A range from 337 billion total tons to 2 trillion total tons.
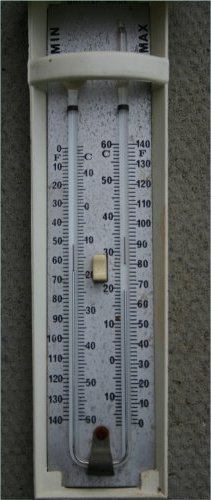
The same evangelistas haven't explained how prior to digital thermometers and computer recording there is the ability to distinguish a mercury thermometer reading
of 38˚ versus 37˚.
I know, I know, picky,picky!
But the entire premise of global warming is based on this published number:
Averaged over all land and ocean surfaces, temperatures warmed roughly 1.53°F (0.85ºC) from 1880 to 2012.
How much has the global temperature risen in the last 100 years? | UCAR - University Corporation for Atmospheric Research
Add to it human re-copying and re-copying before computer recordings. All sorts of error opportunities out of the 100,000+ visual/written down readings.

But two aspects of this system for measuring surface temperatures have long been worrying a growing array of statisticians, meteorologists and expert science bloggers. One is that the supposedly worldwide network of stations from which GHCN draws its data is flawed.
Up to 80 per cent or more of the Earth’s surface is not reliably covered at all.
Furthermore, around 1990, the number of stations more than halved, from 12,000 to less than 6,000 – and most of those remaining are concentrated in urban areas or places where studies have shown that, thanks to the “urban heat island effect”, readings can be up to 2 degrees higher than in those rural areas where thousands of stations were lost.
Climategate, the sequel: How we are STILL being tricked with flawed data on global warming
A range from 337 billion total tons to 2 trillion total tons.
The same evangelistas haven't explained how prior to digital thermometers and computer recording there is the ability to distinguish a mercury thermometer reading
of 38˚ versus 37˚.
I know, I know, picky,picky!
But the entire premise of global warming is based on this published number:
Averaged over all land and ocean surfaces, temperatures warmed roughly 1.53°F (0.85ºC) from 1880 to 2012.
How much has the global temperature risen in the last 100 years? | UCAR - University Corporation for Atmospheric Research
Add to it human re-copying and re-copying before computer recordings. All sorts of error opportunities out of the 100,000+ visual/written down readings.
But two aspects of this system for measuring surface temperatures have long been worrying a growing array of statisticians, meteorologists and expert science bloggers. One is that the supposedly worldwide network of stations from which GHCN draws its data is flawed.
Up to 80 per cent or more of the Earth’s surface is not reliably covered at all.
Furthermore, around 1990, the number of stations more than halved, from 12,000 to less than 6,000 – and most of those remaining are concentrated in urban areas or places where studies have shown that, thanks to the “urban heat island effect”, readings can be up to 2 degrees higher than in those rural areas where thousands of stations were lost.
Climategate, the sequel: How we are STILL being tricked with flawed data on global warming