Kimura
VIP Member
But having our currency lose 96% of its value is a good thing
That's extremely misleading.
Follow along with the video below to see how to install our site as a web app on your home screen.
Note: This feature may not be available in some browsers.
But having our currency lose 96% of its value is a good thing
Yeah you know what the constraints are? You're unable to print as much money as you need out of thin air.
Money and Wealth actually had to be EARNED!
What a concept huh?
I second that.
Data por favor?
Toro knows the Banking crisis of 1907 was fabricated so he's being disingenuous here.
Just Google "Bank Crisis of 1907".
Just highlight the above text and right click, it'll say "Search Google for" and choose "Bank Crisis of 1907".
That even works in my ChromeBook.
I was a little harsh, since I like PC, so I extended my apologies to her for being obnoxious.
Instead, I will rephrase: That's very, very silly.
")
I second that.
Data por favor?
The St Louis Fed used to have a great site that estimated real GDP capita per year for every year since 1790. Several years ago, I looked at the annual compounded growth through the 1800s compared to the 1900s, and found that the 1900s had higher growth.
I believe that the reason why real total GDP was higher in the 19th century was because immigration and population growth was high. Adjusted for population, GDP actually lagged.
But, I'd happily recant if someone showed me otherwise.
Courtesy of Lord Keynes:
US Real Per Capita GDP from 1870–2001
The following is Angus Maddison’s data on real per capita GDP from 1870 to 2001, with my calculations of annual and decadal growth rates. The estimates for the 19th century come from Balke and Gordon (1989), and later data from standard sources:Real US Per Capita GDP 1870–2001
(in 1990 international Geary-Khamis dollars)
Year | GDP | Growth rate
1870 | 2445 |
1871 | 2489 | 1.79%
1872 | 2524 | 1.40%
1873 | 2562 | 1.50%
1874 | 2601 | 1.50%
1875 | 2643 | 1.61%
1876 | 2686 | 1.62%
1877 | 2732 | 1.71%
1878 | 2780 | 1.75%
1879 | 2829 | 1.76%
1880 | 2880 | 1.80%
1881 | 2921 | 1.42%
1882 | 2963 | 1.43%
1883 | 3008 | 1.51%
1884 | 3056 | 1.59%
1885 | 3106 | 1.63%
1886 | 3158 | 1.67%
1887 | 3213 | 1.74%
1888 | 3270 | 1.77%
1889 | 3330 | 1.83%
1890 | 3392 | 1.86%
1891 | 3467 | 2.21%
1892 | 3728 | 7.52%
1893 | 3478 | -6.70%
1894 | 3314 | -4.71%
1895 | 3644 | 9.95%
1896 | 3504 | -3.84%
1897 | 3769 | 7.56%
1898 | 3780 | 0.29%
1899 | 4051 | 7.16%
1900 | 4091 | 0.98%
1901 | 4464 | 9.11%
1902 | 4421 | -0.96%
1903 | 4551 | 2.94%
1904 | 4410 | -3.09%
1905 | 4642 | 5.26%
1906 | 5079 | 9.41%
1907 | 5065 | -0.27%
1908 | 4561 | -9.95%
1909 | 5017 | 9.99%
1910 | 4964 | -1.05%
1911 | 5046 | 1.65%
1912 | 5201 | 3.07%
1913 | 5301 | 1.92%
1914 | 4799 | -9.46%
1915 | 4864 | 1.35%
1916 | 5459 | 12.2%
1917 | 5248 | -3.86%
1918 | 5659 | 7.83%
1919 | 5680 | 0.37%
1920 | 5552 | -2.25%
1921 | 5323 | -4.12%
1922 | 5540 | 4.07%
1923 | 6164 | 11.26%
1924 | 6233 | 1.11%
1925 | 6282 | 0.78%
1926 | 6602 | 5.09%
1927 | 6576 | -0.39%
1928 | 6569 | -0.10%
1929 | 6899 | 5.02%
1930 | 6213 | -9.94%
1931 | 5691 | -8.40%
1932 | 4908 | -13.75%
1933 | 4777 | -2.66%
1934 | 5114 | 7.05%
1935 | 5467 | 6.90%
1936 | 6204 | 13.48%
1937 | 6430 | 3.64%
1938 | 6126 | -4.72%
1939 | 6561 | 7.10%
1940 | 7010 | 6.84%
1941 | 8206 | 17.06%
1942 | 9741 | 18.70%
1943 | 11518 | 18.24%
1944 | 12333 | 7.07%
1945 | 11709 | -5.05%
1946 | 9197 | -21.45%
1947 | 8886 | -3.38%
1948 | 9065 | 2.01%
1949 | 8944 | -1.33%
1950 | 9561 | 6.89%
1951 | 10116 | 5.80%
1952 | 10316 | 1.97%
1953 | 10613 | 2.87%
1954 | 10359 | -2.39%
1955 | 10897 | 5.19%
1956 | 10914 | 0.15%
1957 | 10920 | 0.05%
1958 | 10631 | -2.64%
1959 | 11230 | 5.63%
1960 | 11328 | 0.87%
1961 | 11402 | 0.65%
1962 | 11905 | 4.41%
1963 | 12242 | 2.83%
1964 | 12773 | 4.33%
1965 | 13419 | 5.05%
1966 | 14134 | 5.32%
1967 | 14330 | 1.38%
1968 | 14863 | 3.71%
1969 | 15179 | 2.12%
1970 | 15030 | -0.98%
1971 | 15304 | 1.82%
1972 | 15944 | 4.18%
1973 | 16689 | 4.67%
1974 | 16491 | -1.18%
1975 | 16284 | -1.25%
1976 | 16975 | 4.24%
1977 | 17567 | 3.48%
1978 | 18373 | 4.58%
1979 | 18789 | 2.26%
1980 | 18577 | -1.12%
1981 | 18856 | 1.50%
1982 | 18325 | -2.81%
1983 | 18920 | 3.24%
1984 | 20123 | 6.35%
1985 | 20717 | 2.95%
1986 | 21236 | 2.50%
1987 | 21788 | 2.59%
1988 | 22499 | 3.26%
1989 | 23059 | 2.48%
1990 | 23201 | 0.61%
1991 | 22785 | -1.79%
1992 | 23169 | 1.68%
1993 | 23477 | 1.32%
1994 | 24130 | 2.78%
1995 | 24484 | 1.46%
1996 | 25066 | 2.37%
1997 | 25819 | 3.00%
1998 | 26619 | 3.09%
1999 | 27395 | 2.91%
2000 | 28129 | 2.67%
2001 | 27948 |
(Maddison 2006: 87–89).
Average Decadal Real Per Capita Growth Rates
Average Growth Rate 1871–1880: 1.64%
Average Growth Rate 1881–1890: 1.65%
Average Growth Rate 1891–1900: 2.04%
Average Growth Rate 1901–1910: 2.13%
Average Growth Rate 1911–1920: 1.28%
Average Growth Rate 1921–1930: 1.27%
Average Growth Rate 1931–1940: 1.54%
Average Growth Rate 1941–1950: 3.87%
Average Growth Rate 1951–1960: 1.75%
Average Growth Rate 1961–1970: 2.88%
Average Growth Rate 1971–1980: 2.16%
Average Growth Rate 1981–1990: 2.26%
Average Growth Rate 1991–2000: 1.94%
Special Averages
Average Growth Rate 1871–1900: 1.78%
Average Growth Rate 1871–1914: 1.63%
Average Growth Rate 1873–1879: 1.64%
Average Growth Rate 1879 to 1896: 1.36%
Roaring 20s, Average Growth Rate 1920–1929: 2.04%
Recovery from Depression 1934–1940: 5.75%
Average Growth Rate 1948–1973: 2.30%.We can now rank the various decadal averages from the lowest to highest:
(1) Average Growth Rate 1921–1930: 1.27%
(2) Average Growth Rate 1911–1920: 1.28%
(3) Average Growth Rate 1931–1940: 1.54%
(4) Average Growth Rate 1871–1880: 1.64%
(5) Average Growth Rate 1881–1890: 1.65%
(6) Average Growth Rate 1951–1960: 1.75%
(7) Average Growth Rate 1991–2000: 1.94%
(8) Average Growth Rate 1891–1900: 2.04%
(9) Average Growth Rate 1901–1910: 2.13%
(10) Average Growth Rate 1971–1980: 2.16%
(11) Average Growth Rate 1981–1990: 2.26%
(12) Average Growth Rate 1961–1970: 2.88%
(13) Average Growth Rate 1941–1950: 3.87%.
If we remove those decades where the average decade real per capita GDP growth rates were distorted by wars (1910s and 1940s), we obtain this list:
(1) Average Growth Rate 1921–1930: 1.27%
(2) Average Growth Rate 1931–1940: 1.54%
(3) Average Growth Rate 1871–1880: 1.64%
(4) Average Growth Rate 1881–1890: 1.65%
(5) Average Growth Rate 1951–1960: 1.75%
(6) Average Growth Rate 1991–2000: 1.94%
(7) Average Growth Rate 1891–1900: 2.04%
(8) Average Growth Rate 1901–1910: 2.13%
(9) Average Growth Rate 1971–1980: 2.16%
(10) Average Growth Rate 1981–1990: 2.26%
(11) Average Growth Rate 1961–1970: 2.88%.
Some observations:
(1) the 1870s stands out as the third worst peacetime decade of all time. Only those decades affected by the Great Depression (1920s and 1930s) were worse.
(2) The 1960s, the era when Keynesian macroeconomic management of the US economy was at its height, stands out as the best decade.
(3) The 1980s was the second best decade. But then Reagan’s economic policy was merely Keynesian after 1982, so this is not that big a surprise.
(4) Even the 1970s – the era of the oil shocks and stagflation crisis – had a respectable real per capita GDP growth rate of 2.16%, and was the third highest rate.
(5) If one defines the roaring ’20s as the 1920–1929, its average growth rate was 2.04%
(6) The average real per capita GDP growth rate from 1871–1914 during the gold standard era was 1.63%. The era of classic US Keynesianism (1948–1973) had a rate of 2.30%. The latter period emerges as the clear winner.
BIBLIOGRAPHY
Balke, N. S., and R. J. Gordon, 1989. “The Estimation of Prewar Gross National Product: Methodology and New Evidence,”Journal of Political Economy 97.1: 38–92.
Maddison, Angus. 2003. The World Economy: Historical Statistics. OECD Publishing, Paris.
Social Democracy for the 21st Century A Post Keynesian Perspective US Real Per Capita GDP from 1870 8211 2001
The gold standard constrained the FED; they couldn't lend banks the convertible f/x they needed to patch over withdrawal demands. Thousands of banks failed, we needed a bank holiday and reorganization needed to occur.
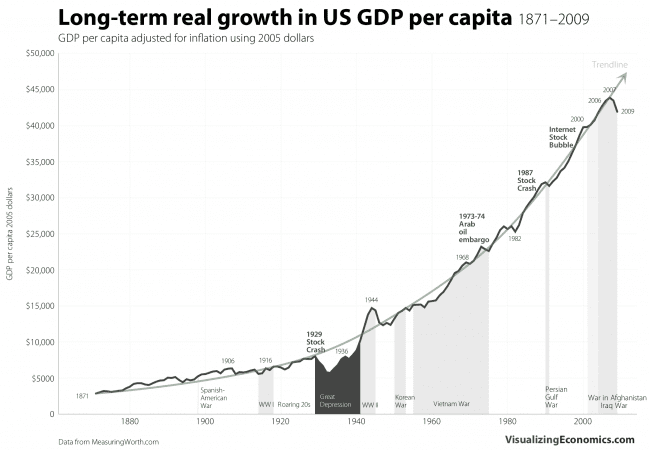
This is an amazing graph. It goes back to 1870 and ends in 2006. If it included after 2006, it would show a slight deviation down then up on the same trajectory.

This is an amazing graph. It goes back to 1870 and ends in 2006. If it included after 2006, it would show a slight deviation down then up on the same trajectory.
This is an amazing graph. It goes back to 1870 and ends in 2006. If it included after 2006, it would show a slight deviation down then up on the same trajectory.
so whats the conclusion? Despite liberal govt interference capitalists continue to invent new things and the economy always grows? Or, growth would have been 4% without all the turmoil caused by liberal intervention.
I would suggest to you, that if the government ever put in place a tax system, without any deductions or methods for reducing tax bills, or tax avoidance... the result would be havoc. I truly believe that.
First.... notice the scale at the bottom. They changed the scale. Do you see?
From the 1870 to 1970, its increase in 20 year incriments steadily. Then from 1970, it jumps to 2000, and they double the slide on the graph.... making it LOOK as though the scale is the same. But it's not. Remember: "There are lies, damned lies, and statistics" - Mark Twain.
so whats the conclusion? Despite liberal govt interference capitalists continue to invent new things and the economy always grows? Or, growth would have been 4% without all the turmoil caused by liberal intervention.
There are many who have a somewhat....pejorative... view of the Federal Reserve, some of which includes the following.
1. "From 1836 until 1913, when the Federal Reserve Act was snuck through Congress, the United States did not have a central bank. It is no coincidence that this period of time marked the greatest real economic growth in the history of our nation.
Can you back this claim up?
Thanks.
"It is not a coincidence that the greatest period of economic growth in U.S. history was between the Civil War and 1913. The following information comes from Wikipedia...
The Gilded Age saw the greatest period of economic growth in American history. After the short-lived panic of 1873, the economy recovered with the advent of hard money policies and industrialization. From 1869 to 1879, the US economy grew at a rate of 6.8% for real GDP and 4.5% for real GDP per capita, despite the panic of 1873. The economy repeated this period of growth in the 1880s, in which the wealth of the nation grew at an annual rate of 3.8%, while the GDP was also doubled."
During The Best Period Of Economic Growth In U.S. History There Was No Income Tax And No Federal Reserve
I checked your Wikipedia link. It doesn't say that.
Take a look at the graphs and tables above.
From this book
Contours of the World Economy 1-2030 AD Essays in Macro-Economic History 9780199227204 Economics Books Amazon.com
page 382 in Statistical Appendix A
US real GDP per capita
1870 - $2,445
1913 - $5,301
Do the math and that's a compounded annual growth rate of 1.8%.
This time period was marked by what is now known as The Long Depression. Before the Great Depression, the Long Depression was called The Great Depression.
Long Depression - Wikipedia the free encyclopedia
"I checked your Wikipedia link. It doesn't say that."
No, you didn't.
I quoted the entire passage.....that's why it begins with quotation marks.
There are two quotation marks, and I simply gave you what you requested.
