Says the guy who can't even provide a single piece of observed, measured evidence that supports the AGW hypothesis over natural variability..
Actually, there is some evidence. That you don't see it, is not on me. That's one you.
Here you go Moron. Brian Cox is much more qualified than you or any other denier on this board. God you guys are thick.
I am not sure what sort of "evidence" you believe is in that steaming pile, but by all means, lets take a look at it.
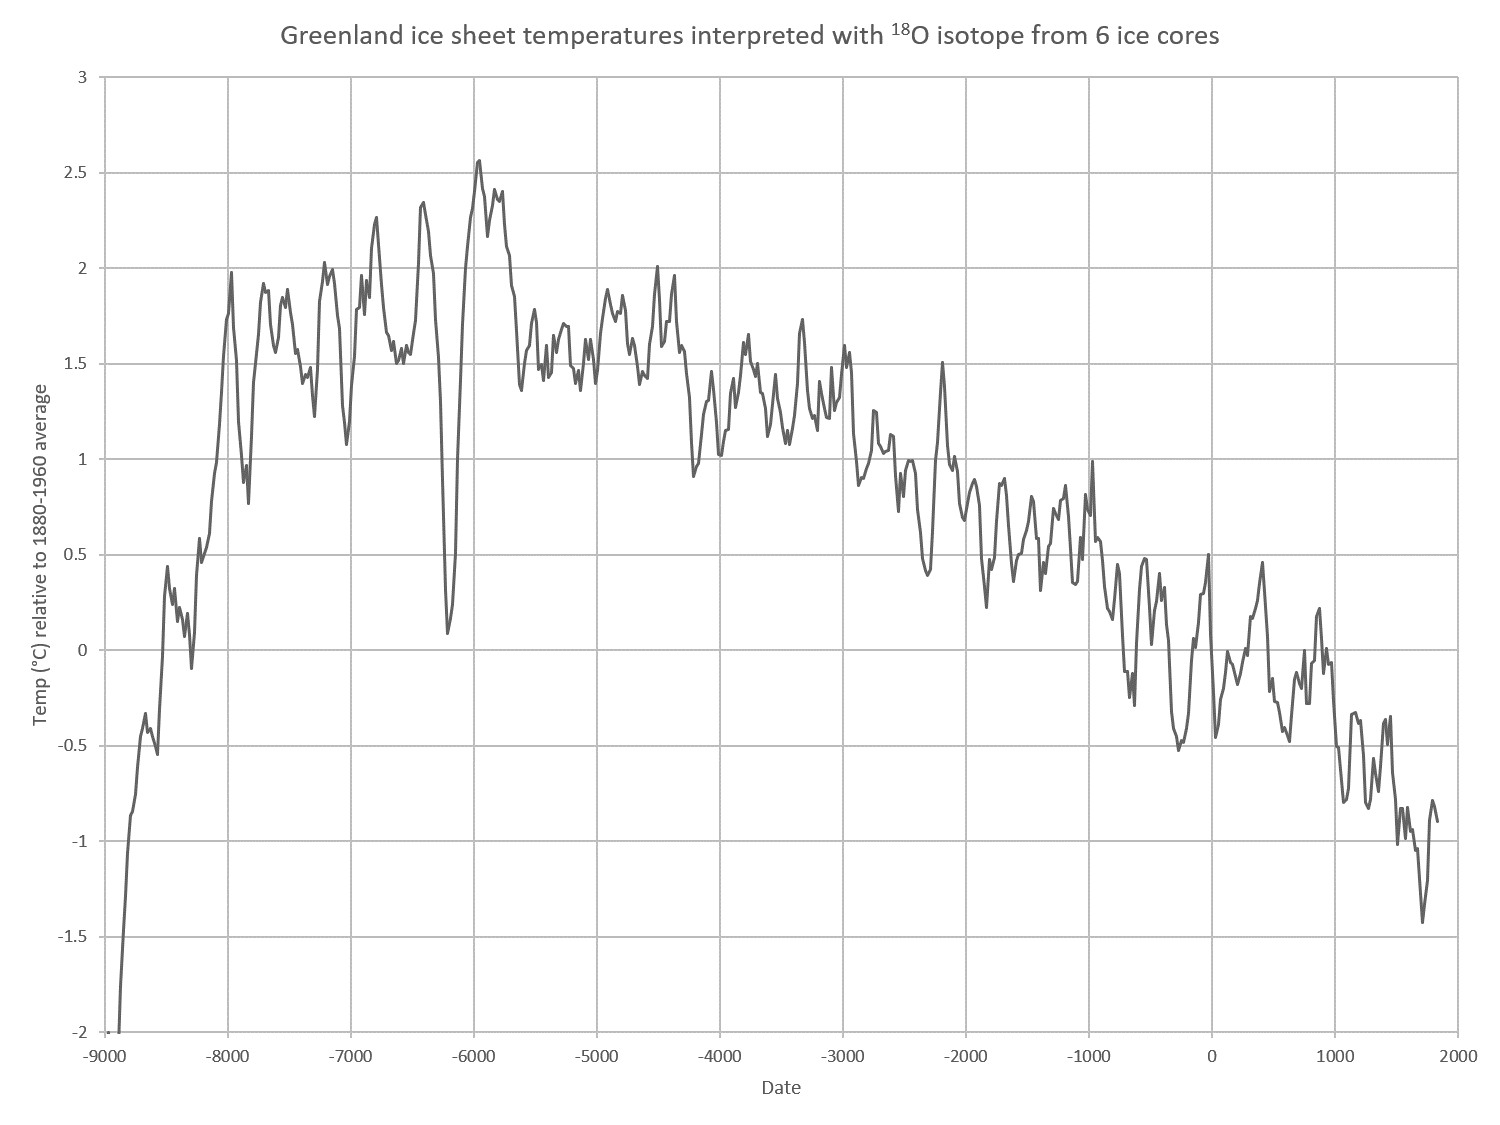
At about 1:24 they are sqawking about the fact that according to "some" data bases, the temperature has risen 1.5 degrees in the past 150 years. I am not sure what you find so alarming about that. The best temperature reconstructions we have are derived from ice cores. Those ice cores show temperature increases that are far greater than 1.5 degrees, and they show that those increases happened much more quickly than any change we have seen. So what, exactly about that do you believe is evidence that supports the man made climate change hypothesis over natural variability?
This temperature reconstruction is from the GISP2 ice core collected in greenland and is considered, by climate science, to be the gold standard of temperature reconstructions. As you can see, this gold standard temperature reconstruction shows clearly that the present is cooler than it has been for most of the past 10,000 years...and at present, we haven't even warmed up to the temperatures that existed prior to the onset of the little ice age. The fact is that your alarmist hero on the video is, while telling a half truth, is certainly not telling you anything like the whole story. He talks about a "clear rise" in temperature but doesn't bother to mention the clear decline that has been happening over the past 10,000 years since the holocene optimum.
This graph shows temperature increases and decreases that are far greater, and far faster than anything we have seen happening multiple times over the past 10,000 years and clearly demonstrates that your climate hero is being a great deal less than honest with his audience...how unsurprising is that?
At about 1:42 they suggest that an additional 1.4 degree increase will bring us to a "critical" point...As you can see, another 1.4 degree increase will put us somewhere between the temperature it was prior to the onset of the little ice age, and the temperatures of the Roman warm period...a fabulously good time to be alive insofar as the climate goes...it was a great time of relative plenty in the ancient world...crops flourished...life was good...and even that is not as warm as the minoan warming period was...it was those warm temperatures that allowed us to move from being hunter gatherers to civilization builders..
And onward....
Shocking predictions at 2:06...how many more shocking predictions are you going to believe before you wake up...the scientific landscape of the past 3 decades is littered with failed "shocking" predictions made by climate science...
Then at 2:52 he states that the absolute "consensus" is that we are causing the temperature change...right after he made the claim that he could produce facts and figures about how we are causing the climate to change...he reverts to the consensus since there are no observed, measured data which he can use to make a case that we are responsible for the bit of change we have seen over the past 150 years...the glazed look on the faces of the audience clearly indicate that they have no idea that they have just been scammed. Like you, they believe he just gave them facts and figures that all but prove that mankind is responsible for climate change when all they got was a well delivered bait and switch. Good enough for useful idiots who really haven't taken the time to look at the science and compare it to what people like "professor" cox are actually saying.
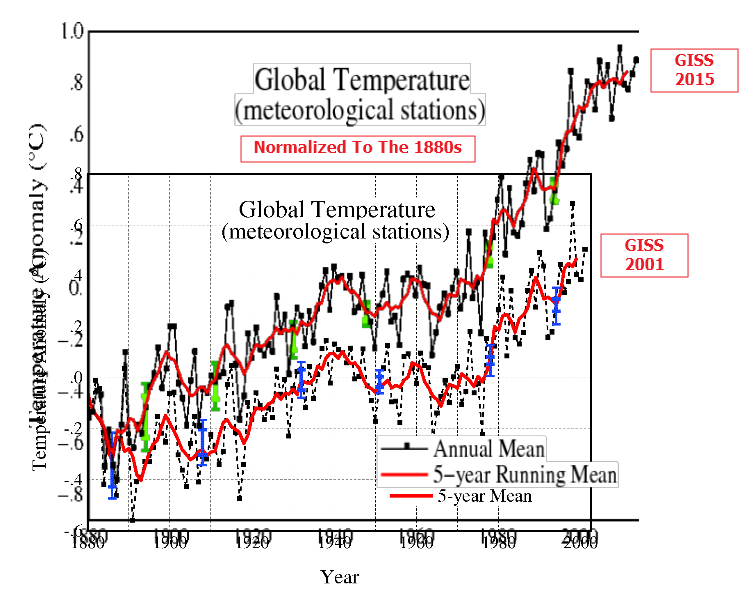
Then at 3:18...he starts in on whether we have the institutional will to respond to the challenge...and has yet to make any rational, supported case that there is a challenge. He hasn't provided a shred of actual observed, measured evidence which supports the claim that there is a challenge to be faced...he provided a few misleading facts about the temperature from the late 1800's to the present, but nothing at all about the fact that the late 1800's heralded the end of the second coldest period of the past 10,000 years...they like to start their graphs at the coldest period possible in order to give the impression of dangerous levels of warming...
Tell me, if I wanted to show you some graphs and my intention was to create a sense of alarm, and urgency, which graph would I be more likely to show you...even though they both show the same thing.
This graph
or this graph
One is likely to create a feeling of unease...especially if you have never taken the time to actually look at the science. But if I showed you only the first one and told you that we were facing a climate catastrophe, how much do you think I could worry you? Could I convince you that you need to change your lifestyle? Could I convince you that you needed to pay more for everything you buy because of the climate and carbon taxes I wanted to place on everything in order to attempt to avert the climate emergency that we are presently in and things were only going to get worse? You have fallen for alarmist bullshit...feeling like a dupe yet? You should be...
and onward...
then at 3:48 the other panelist points out that the longest temperature history we have shows that the temperature increase moving from the 17th to the 18th century was greater, and faster than the present warming cycle... Wonder why your climate hero didn't mention that fact? Could it be that he wants to create a sense of alarm in his audience?
Then at 4:19 he shows "the graph" the very one I posted above....and listen to the useful idiots cheer....compare it to the graph that shows what the climate was like before the end of the second coldest period of the past 10,000 years and tell me how alarming "the graph" is in reality...
Then at 7:15, when your climate hero is confronted with the sort of manipulation of the data that the mainstream sources are guilty of, he goes straight to an ad hominem attack on his challenger...rather than provide some evidence that the data has not been manipulated..he attacks his challenger and suggests that he might not believe that we landed people on the moon.
Here is the extent of the manipulation that the challenger is talking about.
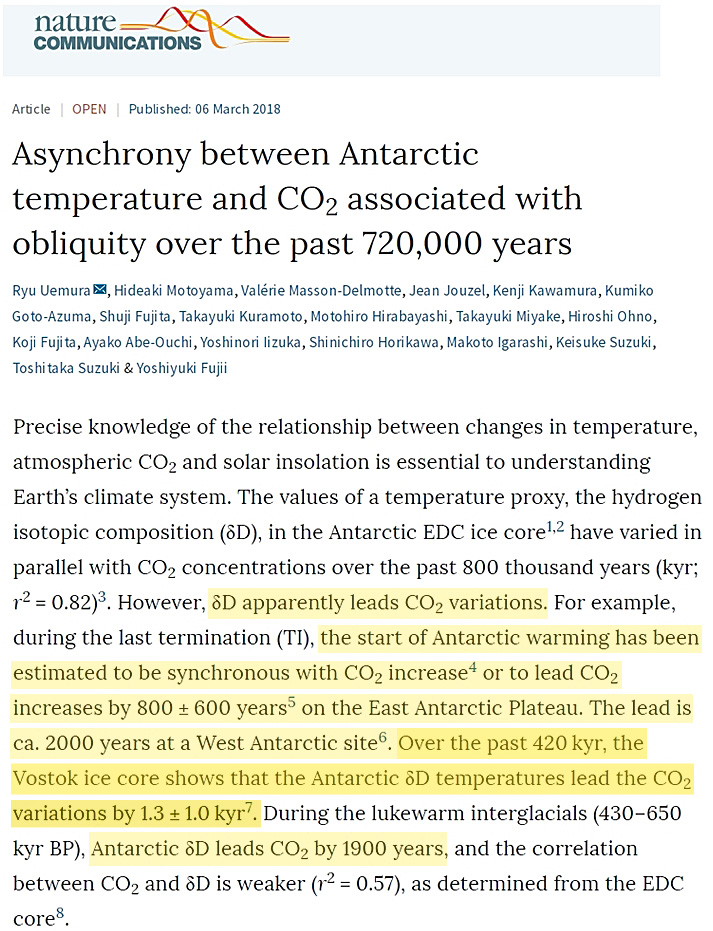
Are you seeing a pattern developing here?......onward.....I didn't seen anything in the rest of the video that even came close to approaching actual evidence that supported his beliefs...There was a brief exchange at about 12:05 where the challenger pointed out, regarding CO2 that the empirical evidence shows that increased CO2 is the result of temperature change...not the cause...your hero attempts to discredit the idea but offers no empirical evidence to support his claims...I can show you peer reviewed, published paper after peer reviewed, published paper which find that our contribution to the total CO2 in the atmosphere is so vanishingly small that it is irrelevant.
The fact is that the amount of CO2 we produce from year to year does not track with the amount of increase in atmospheric CO2. Here is some published, peer reviewed science in answer to your climate hero's denial of the facts.
https://www.researchgate.net/public...SPHERIC_CO2_TO_ANTHROPOGENIC_EMISSIONS_A_NOTE
CLIP: “
A necessary condition for the theory of anthropogenic global warming is that there should be a close correlation between annual fluctuations of atmospheric CO2 and the annual rate of anthropogenic CO2 emissions. Data on atmospheric CO2 and anthropogenic emissions provided by the Mauna Loa measuring station and the CDIAC in the period
1959-2011 were studied using detrended correlation analysis to determine whether, net of their common long term upward trends, the rate of change in atmospheric CO2 is responsive to the rate of anthropogenic emissions in a shorter time scale from year to year. … [
R]esults do not indicate a measurable year to year effect of annual anthropogenic emissions on the annual rate of CO2 accumulation in the atmosphere.”
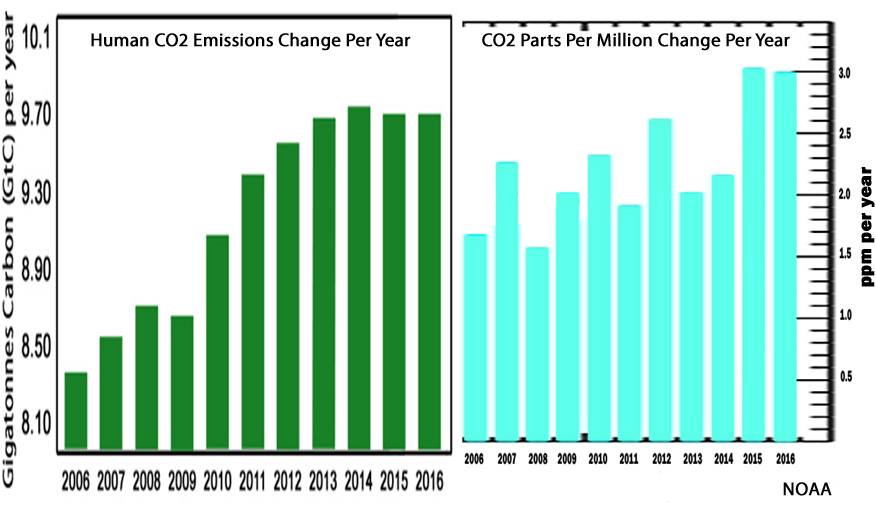
If you look at the graph...assuming that you can read a graph...you will see for example, that there was a rise in our emissions between 2007 and 2008 but a significant decline in the atmospheric CO2 concentration. Do you believe that human CO2 went somewhere to hide and waited around for some years before it decided to have an effect on the total atmospheric CO2 concentration? Then between 2008 and 2009, there was a decline in the amount of CO2 that humans emitted into the atmosphere, but a significant rise in the atmospheric CO2 concentration. Then from 2010 to 2014 there was a large rise in man made CO2 emissions but an overall flat to declining trend in the atmospheric CO2 concentration. Between 2014 to 2016 there was a slight decline in man made CO2 emissions, but a pronounced rise in the atmospheric CO2 concentrations. Like I said, we produce just a fraction of the natural variation in the earth's own CO2 making machinery from year to year and we are learning that we really don't even have a handle on how much CO2 the earth is producing...the undersea volcanoes are a prime example of how much we don't know.
https://www2.meteo.uni-bonn.de/bibliothek/Flohn_Publikationen/K287-K320_1981-1985/K299.pdf
CLIP:
“The recent increase of the CO2-content of air varies distinctly from year to year, rather independent from the irregular annual increase of global CO2-production from fossil fuel and cement, which has since 1973 decreased from about 4.5 percent to 2.25 percent per year (Rotty 1981).”
“Comparative investigations (Keeling and Bacastow 1977, Newll et al. 1978, Angell 1981) found
a positive correlation between the rate of increase of atmospheric CO2 and the fluctuations of sea surface temperature (SST) in the equatorial Pacific, which are caused by rather abrupt changes between upwelling cool water and downwelling warm water (“El Niño”) in the eastern equatorial Pacific. Indeed the cool upwelling water is not only rich in (anorganic) CO2 but also in nutrients and organisms. (algae) which consume much atmospheric CO2 in organic form, thus reducing the increase in atmospehreic CO2. Conversely the warm water of tropical oceans, with SST near 27°C, is barren, thus leading to a reduction of CO2 uptake by the ocean and greater increase of the CO2. … A crude estimate of these differences is demonstrated by the fact that
during the period 1958-1974, the average CO2-increase within five selective years with prevailing cool water only 0.57 ppm/a [per year], while during five years with prevailing warm water it was 1.11 ppm/a. Thus in a a warm water year, more than one Gt (1015 g) carbon is additionally injected into the atmosphere, in comparison to a cold water year.”
Practically every actual study ever done tells us that increases in CO2 follow increases in temperature...that means that increased CO2 is the result of increased temperature, not the cause of increased temperature...which makes sense since warm oceans hold less CO2 and as they warm, they outages CO2.
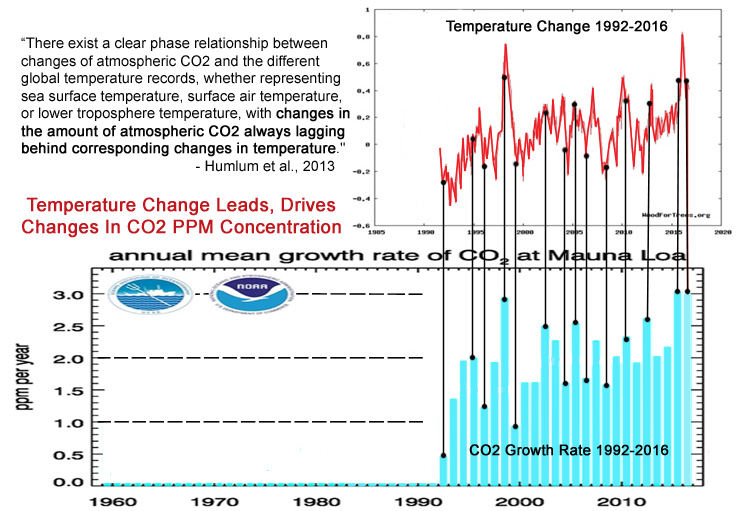
https://www.researchgate.net/public...spheric_carbon_dioxide_and_global_temperature
CLIP"
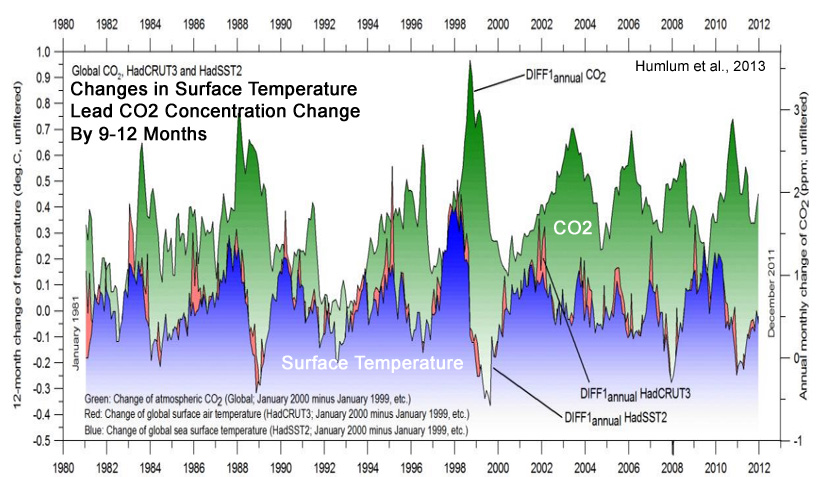
“There exist a clear phase relationship between changes of atmospheric CO2 and the different global temperature records, whether representing sea surface temperature, surface air temperature, or lower troposphere temperature,
with changes in the amount of atmospheric CO2 always lagging behind corresponding changes in temperature.”
(1) The overall global temperature change sequence of events appears to be from 1) the ocean surface to 2) the land surface to 3) the lower troposphere.
(2) Changes in global atmospheric CO2 are lagging about 11–12 months behind changes in global sea surface temperature.
(3) Changes in global atmospheric CO2 are lagging 9.5–10 months behind changes in global air surface temperature.
(4) Changes in global atmospheric CO2 are lagging about 9 months behind changes in global lower troposphere temperature.
(5) Changes in ocean temperatures appear to explain a substantial part of the observed changes in atmospheric CO2 since January 1980.
(6)
CO2 released from anthropogenic sources apparently has little influence on the observed changes in atmospheric CO2, and changes in atmospheric CO2 are not tracking changes in human emissions.
(7) On the time scale investigated, the overriding effect of large volcanic eruptions appears to be a reduction of atmospheric CO2, presumably due to the dominance of associated cooling effects from clouds associated with volcanic gases/aerosols and volcanic debris.
(8)
Since at least 1980 changes in global temperature, and presumably especially southern ocean temperature, appear to represent a major control on changes in atmospheric CO2.
SAGE Journals: Your gateway to world-class research journals
CLIP: “[T]he warming and cooling of the ocean waters control how much CO2 is exchanged with atmosphere and thereby controlling the concentration of atmospheric CO2. It is obvious that when the oceans are cooled, in this case due to volcanic eruptions or La Niña events, they release less CO2 and when it was an extremely warm year, due to an El Niño, the oceans release more CO2. [D]uring the measured time 1979 to 2006 there has been a continued natural increase in temperature causing a continued increase of CO2 released into the atmosphere. This implies that temperature variations caused by El Niños, La Niñas, volcanic eruptions, varying cloud formations and ultimately the varying solar irradiation control the amount of CO2 which is leaving or being absorbed by the oceans.”
https://pubs.acs.org/doi/abs/10.1021/ef800581r
CLIP: “[With the short (5−15 year) RT [residence time] results shown to be in quasi-equilibrium, this then supports the (independently based) conclusion that the long-term (∼100 year) rising atmospheric CO2 concentration is not from anthropogenic sources but, in accordance with conclusions from other studies, is most likely the outcome of the rising atmospheric temperature, which is due to other natural factors. This further supports the conclusion that global warming is not anthropogenically driven as an outcome of combustion.”
Error - Cookies Turned Off
“[T]he trend in the airborne fraction [ratio of CO2 accumulating in the atmosphere to the CO2 flux into the atmosphere due to human activity] since 1850 has been 0.7 ± 1.4% per decade, i.e. close to and not significantly different from zero. The analysis further shows that the statistical model of a constant airborne fraction agrees best with the available data if emissions from land use change are scaled down to 82% or less of their original estimates. Despite the predictions of coupled climate-carbon cycle models, no trend in the airborne fraction can be found.”
Like it or not, that last sentence means that there simply is not a discernible trend in the percentage of atmospheric CO2 that can be linked to our emissions...that is because in the grand scheme of things, the amount of CO2 that we produce is very small...not even enough to have any measurable effect on the year to year variation of the earth's own CO2 making processes...
Here is a paper from James Hansen himself...the father of global warming and the high priest of anthropogenic climate change...
Climate forcing growth rates: doubling down on our Faustian bargain - IOPscience
CLIP: “However, it is the dependence of the airborne fraction on fossil fuel emission rate that makes the post-2000 downturn of the airborne fraction particularly striking.
The change of emission rate in 2000 from 1.5% yr-1 [1960-2000] to 3.1% yr-1 [2000-2011], other things being equal, would [should] have caused a sharp increase of the airborne fraction”
Even someone who can't read a graph should be able to look at that one produced by hansen and see that the amount of CO2 in the atmosphere simply does not track with the amount of CO2 that we produce.
You can go on endlessly about what you believe...and what you have been told but when you look at the actual science, it is clear that what you believe and what you have been told simply is not true. That is the problem with letting someone else provide you with an opinion...if they don't want you to know the problems inherent in your opinion, they don't give you information like the published, peer reviewed papers above...they simply let you believe that we are the cause of rising CO2, and that the CO2 is responsible for the warming in the atmosphere and tell you that it is true without having any data at all to support the claim.
You continue to believe what you like...it is clear by now that is precisely what you will do...but the information above is peer reviewed and published by climate scientists...and supports my claim that we are no the ones driving the amount of CO2 present in the atmosphere, and that the present warming is in no way unusual or unprecedented. I am pretty sure that you will disregard all the data above in favor of what you want to believe...which makes you the denier...not me. I can provide actual published science to support my claim...published science which you will deny in favor of your belief and political leaning.