- Thread starter
- #61
Actually I didn't compile that graph but hey, Look at that.
The only thing baseline represents is where they stick 0 on a graph.
If you really want to know my preference for baseline it'd be somewhere prior to the industrial age.

This one uses the 1961~1990 average and its obviously high when compared to pre industrial norms.
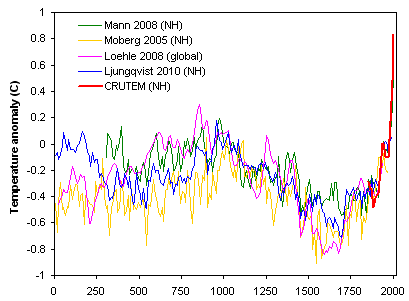
going back 2000 years and using the 1880 average

Here's another, same time frame.

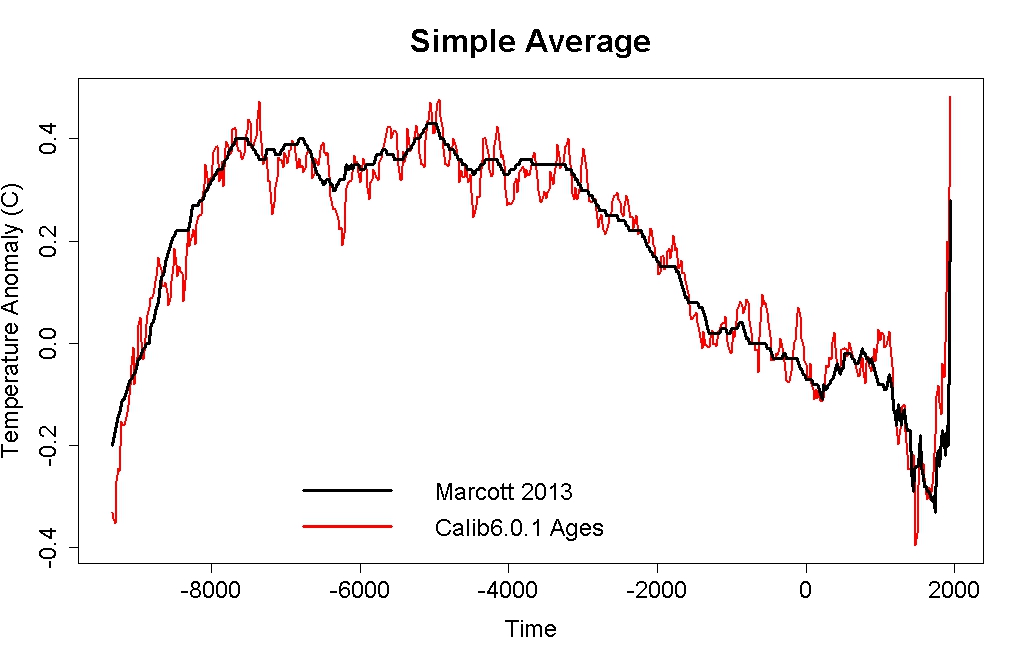
Here's at 10,000 years with a baseline again set in the 1900s
As you can see the baseline can be set wherever you want it really doesn't make a difference.
The graphs resolution is what matters and that gradually diminishes as you try and jamb more and more information onto it such that the dramatic nature of the recent temperature changes we're seeing today, become blurred. I love the fools that post a graph of a few billion years time frame and demand someone point to todays temperature anomaly
IE baseline is irrelevant. Resolution is what a graph needs in order to see whats really going on.
You sure have a knack for false premisses and irrelevancies Todd.
Maybe, however, you noticed the unprecedented nature of the changes in temp and CO2 over the last few years in those graphs tho ;--)
Ever wonder what happens to the environmental system when you throw a wrench at it like that ?
Ever heard of aerobic stratification ? Anoxic events ? Things like that ?
The only thing baseline represents is where they stick 0 on a graph.
If you really want to know my preference for baseline it'd be somewhere prior to the industrial age.
This one uses the 1961~1990 average and its obviously high when compared to pre industrial norms.
going back 2000 years and using the 1880 average
Here's another, same time frame.
Here's at 10,000 years with a baseline again set in the 1900s
As you can see the baseline can be set wherever you want it really doesn't make a difference.
The graphs resolution is what matters and that gradually diminishes as you try and jamb more and more information onto it such that the dramatic nature of the recent temperature changes we're seeing today, become blurred. I love the fools that post a graph of a few billion years time frame and demand someone point to todays temperature anomaly
IE baseline is irrelevant. Resolution is what a graph needs in order to see whats really going on.
You sure have a knack for false premisses and irrelevancies Todd.
Maybe, however, you noticed the unprecedented nature of the changes in temp and CO2 over the last few years in those graphs tho ;--)
Ever wonder what happens to the environmental system when you throw a wrench at it like that ?
Ever heard of aerobic stratification ? Anoxic events ? Things like that ?