How much was TSI down from the long term average during the Maunder Minimum?
From Wikipedia's article on the Maunder Minimum we have:
Little Ice Age
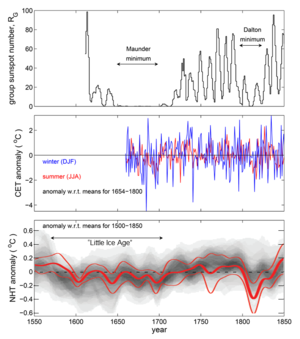 Comparison of group sunspot numbers (top), Central England Temperature (CET) observations (middle) and reconstructions and modeling of Northern Hemisphere Temperatures (NHT). The CET in red are summer averages (for June, July and August) and in blue winter averages (for December of previous year, January and February). NHT in grey is the distribution from basket of paleoclimate reconstructions (darker grey showing higher probability values) and in red are from model simulations that account for solar and volcanic variations. By way of comparison, on the same scales the anomaly for modern data (after 31 December 1999) for summer CET is +0.65oC, for winter CET is +1.34oC, and for NHT is +1.08oC. Sunspot data are as in supplementary data to and Central England Temperature data are as published by the UK Met Office The NHT data are described in box TS.5, Figure 1 of the IPCC AR5 report of Working Group 1.
The Maunder Minimum roughly coincided with the middle part of the
Little Ice Age, during which Europe and North America experienced colder than average temperatures. Whether there is a causal relationship, however, is still controversial, as no convincing mechanism for the solar activity to produce cold temperatures has been proposed, and the current best hypothesis for the cause of the Little Ice Age is that it was the result of volcanic action. The onset of the Little Ice Age also occurred well before the beginning of the Maunder minimum.
The correlation between low sunspot activity and cold winters in England has recently been analyzed using the longest existing surface temperature record, the
Central England Temperature record. They emphasize that this is a regional and seasonal effect relating to European winters, and not a global effect. A potential explanation of this has been offered by observations by NASA's
Solar Radiation and Climate Experiment, which suggest that solar UV output is more variable over the course of the solar cycle than scientists had previously thought. In 2011, an article was published in the
Nature Geoscience journal that uses a climate model with stratospheric layers and the SORCE data to tie low solar activity to jet stream behavior and mild winters in some places (southern Europe and Canada/Greenland) and colder winters in others (northern Europe and the United States). In Europe, examples of very cold winters are 1683-84, 1694–95, and the
winter of 1708–09.
Note that the term "Little Ice Age" applied to the Maunder minimum is something of a misnomer as it implies a period of unremitting cold (and on a global scale), which is not the case. For example, the coldest winter in the
Central England Temperature record is 1683-84, but the winter just two years later (both in the middle of the Maunder minimum) was the fifth warmest in the whole 350-year CET record. Furthermore, summers during the Maunder minimum were not significantly different from those seen in subsequent years. The drop in global average temperatures in paleoclimate reconstructions at the start of the Little Ice Age was between about 1560 and 1600, whereas the Maunder minimum began almost 50 years later.