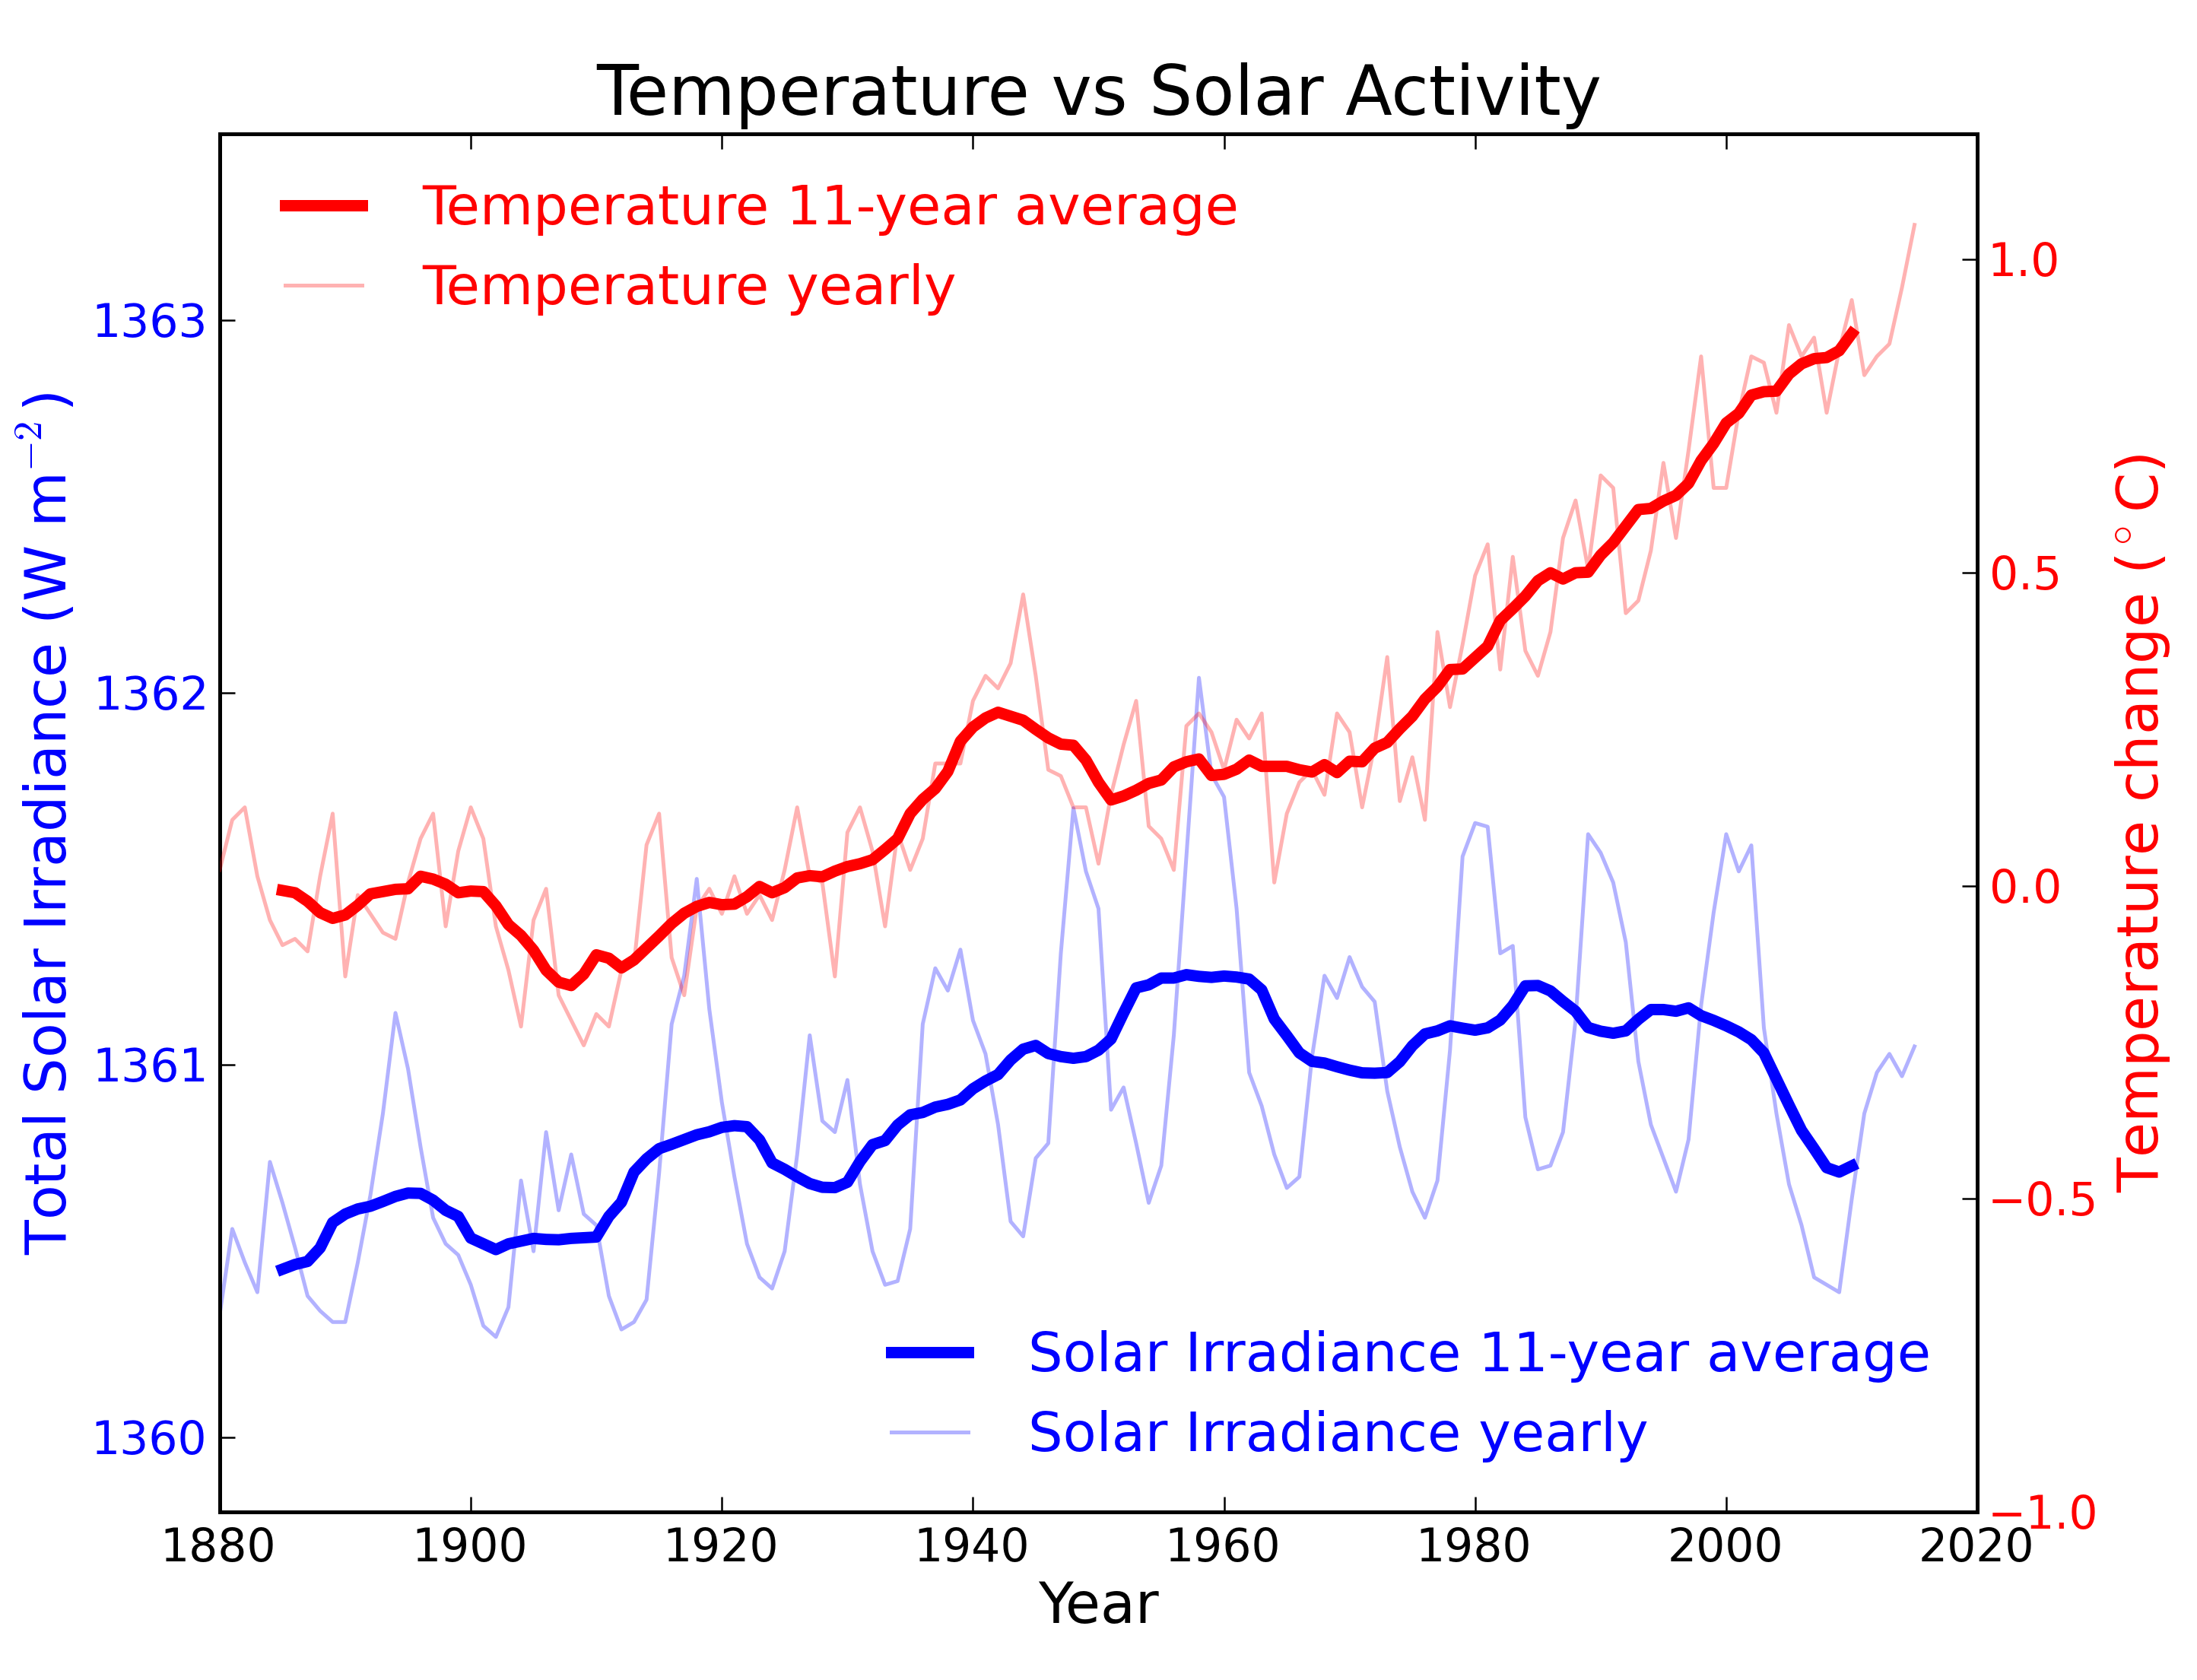
Solar scientists say the "Grand Minimum" will cause a mini ice age next few years..

LIAR!
Sixteen of the 17 warmest years in the 136-year record all have occurred since 2001, with the exception of 1998. The year 2016 ranks as the warmest on record. (Source: NASA/GISS).
Karl Et AL is a lie...
Karl et al has been proven true by third parties.
You just continue to lie like a typical lying scum Trumpist.
PAL REVIEW is review by circle jerk. Having your work verified by your friends is not ethical..
The deniers who fabricated a fake graph to "disprove" Karl et al can hardly talk about ethics!!!!!
You mean the Graph that shows the unaltered temps vs the Karl et Al fabrications?
Yeah that FAKE graph with the lying caption, as if you didn't know!

pausebuster-dataset.jpg

The misleading ‘pausebuster chart’: The red line shows the current NOAA world temperature graph – which relies on the ‘adjusted’ and unreliable sea data cited in the flawed ‘Pausebuster’ paper. The blue line is the UK Met Office’s independently tested and verified ‘HadCRUT4’ record – showing lower monthly readings and a shallower recent warming trend
I know all about your adjusted temp bull shit... Not going to rehash this lie again.. The MET is a British METeorological office... by the way.. they are the ones who called out your lies..
 
Last edited:
Karl et al has been proven true by third parties.
You just continue to lie like a typical lying scum Trumpist.
PAL REVIEW is review by circle jerk. Having your work verified by your friends is not ethical..
The deniers who fabricated a fake graph to "disprove" Karl et al can hardly talk about ethics!!!!!
You mean the Graph that shows the unaltered temps vs the Karl et Al fabrications?
Yeah that FAKE graph with the lying caption, as if you didn't know!

pausebuster-dataset.jpg

The misleading ‘pausebuster chart’: The red line shows the current NOAA world temperature graph – which relies on the ‘adjusted’ and unreliable sea data cited in the flawed ‘Pausebuster’ paper. The blue line is the UK Met Office’s independently tested and verified ‘HadCRUT4’ record – showing lower monthly readings and a shallower recent warming trend
I know all about your adjusted temp bull shit... Not going to rehash this lie again.. The MET is a British meteorological office... by the way.. they called out your lies..
So both you and the fake graph that lying scum deniers used to falsely claim NOAA adjusted the data attest that the HadCRUT4 data is ACCURATE. So why does your fake graph's NOAA data look so different?

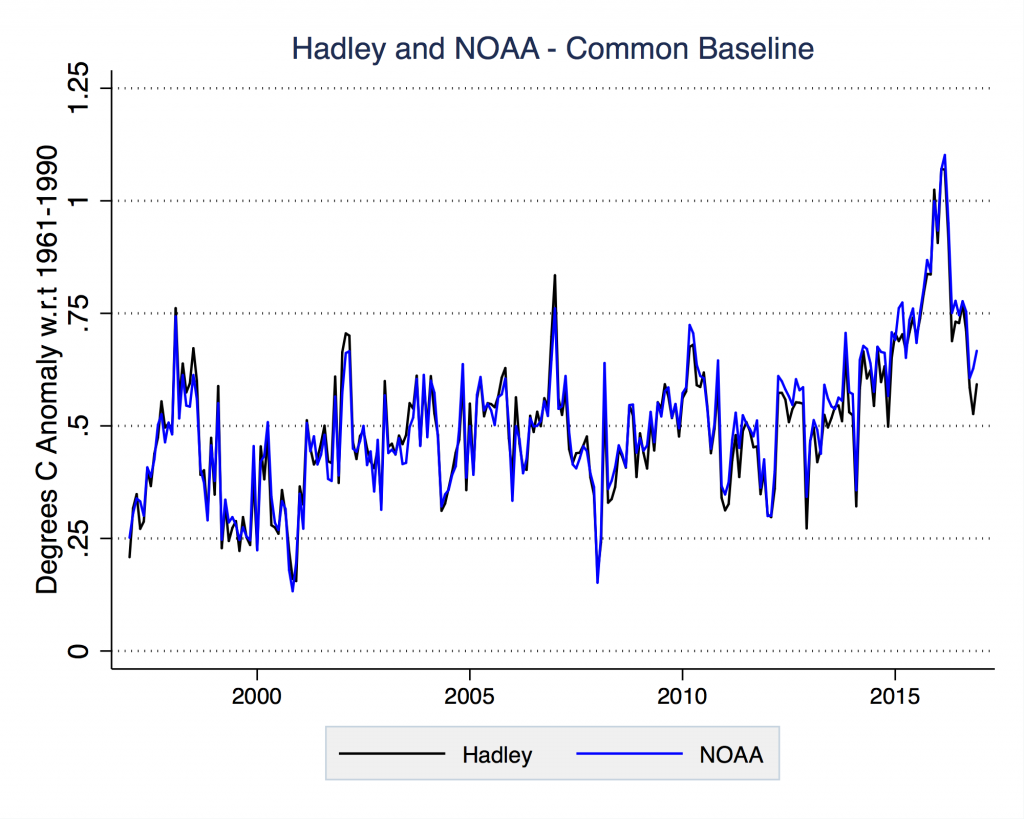
That is because deniers are the lowest lying scum that ever crawled out of a sewer!!! The lying scum deniers used two (2) different baselines for the deliberately dishonest graph, 1961 to 1990 for HadCRUT4 and 1901 to 2000 for NOAA. Of course the lying scum deniers left that critical fact out because they know that dumb SUCKERS like you are too stupid to catch their obvious lies.

Here is a graph using the SAME 1961 to 1990 baseline for both HadCRUT4 and NOAA. You and your lying scum graph have already admitted the HadCrut4 data is proven accurate and it is neatly identical to the NOAA data used by Karl et al. So rather than Karl et al being verified by "pals" you lying scum deniers have actually independently confirmed Karl et al.
Thank you. :asshole:

noaa-hadley-common-baseline-1-1024x819.png
 
Though solar activity certainly and demonstratively has effect on our planet it is not as important to our life form as atmosphere at this point. Granted climate must adjust to solar radiation and it will cause some level of disruption, but changes in atmospheric composition are relatively immediate (see Pinatubo) and ocean current changes due to warming are extreme in their climate impacts.
If our planet does indeed enter an "Ice Age" it will probably be the result of the Atlantic conveyor faltering or slowing and thus Northern latitudes losing the equatorial heating. If this happens we will slip into a new "Little Ice Age" due to climate change.

Solar activity doesn't just have an "effect"...it drives our climate, and very small changes in solar activity spell quite large changes in our climate. CO2 is a political issue, and the claims that CO2 has an effect on our climate are political claims not backed up by the first piece of observed, measured, quantified evidence that supports the AGW hypothesis over natural variability...

Research...actual science, is however beginning to wake up to the fact that it is the sun that determines the climate on planet earth and which direction it moves, and by how much.

“The main driver of the large-scale character of the warm and cold episodes may be changes in the solar activity. Four warm periods – 1626–1637, 1800–1809, 1845– 1859, and 1986–2012 – have been identified to correspond to increased solar activity” – Tejedor et al., 2017


“The activity level of the Modern Maximum (1940–2000) is a relatively rare event, with the previous similarly high levels of solar activity observed 4 and 8 millennia ago” – Yndestad and Solheim, 2017

“A large proportion of climate variations can be explained by the mechanism of action of TSI [total solar irradiance] and cosmic rays (CRs) on the state of the lower atmosphere and other meteorological parameters” – Biktash, 2017

“The solar ‘activity’ increase is the chief driver of the global temperature increase since the LIA [Little Ice Age]” – Page, 2017

“Climate … follows SA [solar activity] fluctuations on multidecadal to centennial time scales” – Moreno et al., 2017

“The emerging causal effects from SS [solar activity] to GT [global temperatures], especially for recent decades, are overwhelmingly proved” – Huang et al., 2017

Quantifying climatic variability in monsoonal northern China over the last 2200 years and its role in driving Chinese dynastic changes

It has been widely suggested from both climate modeling and observation data that solar activity plays a key role in driving late Holocene climatic fluctuations by triggering global temperature variability and atmospheric dynamical circulation … The strengthened solar activity could be significantly amplified by the variations in ultraviolet radiation as well as clouds, resulting in the marked variability in global surface temperature

Do trend extraction approaches affect causality detection in climate change studies? - ScienceDirect

Various scientific studies have investigated the causal link between solar activity (SS) and the earth’s temperature (GT). [T]he corresponding CCM [Convergent Cross Mapping] results indicate increasing significance of causal effect from SS [solar activity] to GT [global temperature] since 1880 to recent years, which provide solid evidences that may contribute on explaining the escalating global tendency of warming up recent decades. … The connection between solar activity and global warming has been well established in the scientific literature. For example, see references [1–10]. … Among which, the SSA [Singular Spectrum Analysis] trend extraction is identified as the most reliable method for data preprocessing, while CCM [Convergent Cross Mapping] shows outstanding performance among all causality tests adopted. The emerging causal effects from SS [solar activity] to GT [global temperatures], especially for recent decades, are overwhelmingly proved, which reflects the better understanding of the tendency of global warming.

SAGE Journals: Your gateway to world-class journal research

This paper demonstrates that global warming can be explained without recourse to the greenhouse theory. This explanation is based on a simple model of the Earth’s climate system consisting of three layers: the surface, a lower and an upper atmospheric layer. The distinction between the atmospheric layers rests on the assumption that the latent heat from the surface is set free in the lower atmospheric layer only. The varying solar irradiation constitutes the sole input driving the changes in the system’s energy transfers.


Solar-Activity-1600-2010-TSI-Blaauw-2017.jpg


Mid-late Holocene climatic changes recorded by loess deposits in the eastern margin of the Tibetan Plateau: Implication for human migrations - ScienceDirect

A warmer and wetter climate prevailed since ∼4800 a BP and was interrupted by a sharp cold reversal at approximately 3300 a BP that was likely caused by solar irradiance forcing, which resulted in a global cold climatic change and glacier advance.

http://www.tandfonline.com/doi/pdf/10.1080/16742834.2017.1321951

Solar wind and electric-microphysical process is the key mechanism that affects climate
[T]he wintertime Iceland Low in the North Atlantic was very sensitive to solar wind variations and played an important role in the process of solar wind and electric-microphysical effects on climate. Tinsley and Zhou (2015) improved the collision and parameterization scheme that varied with electric quantity in a cloud microphysics process and quantitatively evaluated the effects of high-energetic particle flux on cloud charge. This achievement not only supports the marked association of solar activity with weather and climate change on various time scales, but also but also avails the quantitative accession of solar impacts on climate.

http://orbi.ulg.ac.be/handle/2268/207496

A deeper analysis reveals several periods of significant rapid climate change during the Holocene (at 10.7-9.2 ka, 8.2-7.9 ka, 7.2-6.2 ka, 4.8-4.5 ka, and 3-2.4 ka BP),
which are similar to the cold events detected from different natural paleoclimate archivers. A comparison between the geochemical analysis of Père Noël speleothem and solar activity (sunspot number) reveals a significant correlation. Spectral analysis methods reveal common solar periodicities (Gleissberg cycle, de Vries cycle, unnamed 500 year, Eddy cycles, and Hallstatt cycle). The geochemical analyses have the potential to prove that PN speleothem is sensitive to changes in solar activity on centennial and millennial timescales during the Holocene.

https://www.irsm.cas.cz/materialy/acta_content/2017_doi/Ma_AGG_2017_0008.pdf

The modulation action from solar activity plays an important role in the temperature change, and there is a possible association existing in the global land-ocean temperature and solar activity on decade time scales. … About 11-year period, a remarkable oscillation of solar activity, continually exists in wavelet transform of solar variation. According to the cross wavelet transform, solar activity influences global land-ocean temperature change on ~11-year time scales during 1935-1995 with above the 5 % significance level.

http://www.sciencedirect.com/science/article/pii/S0031018217300044

Late Holocene climate change in coastal East Asia was likely driven by ENSO variation. Our tree pollen index of warmness (TPIW) shows important late Holocene cold events associated with low sunspot periods such as Oort, Wolf, Spörer, and Maunder Minimum. Comparisons among standard Z-scores of filtered TPIW, ΔTSI, and other paleoclimate records from central and northeastern China, off the coast of northern Japan, southern Philippines, and Peru all demonstrate significant relationships [between solar activity and climate]. This suggests that solar activity drove Holocene variations in both East Asian Monsoon (EAM) and El Niño Southern Oscillation (ENSO). In particular, the latter seems to have predominantly controlled the coastal climate of East Asia to the extent that the influence of precession was nearly muted during the late Holocene.

http://www.sciencedirect.com/science/article/pii/S0273117716306512

[/quote]Significant correlation was found between SST [sea surface temperatures] in NA [the North Atlantic] and solar activity (both instrumental data and proxies) during AD 1716–1986. Thus, the connection between Northern Fennoscandian climate and solar activity, which has been previously established at century-scale (Ogurtsov et al., 2001, 2002, 2013) and millennial-scale (Helama et al., 2010), is confirmed for AD 1716–1986 over the entire frequency range using unfiltered records (with the exception for AMO reconstruction after Mann et al. (2009)). … Changes in solar ultra-violet (UV) radiation might provide a solar-climatic link over Northern Europe. Actually, modeling work by (Ineson et al., 2011) showed that that solar UV (200-320 nm) decadal variability drives appreciable temperature changes in mesosphere and upper stratosphere largely through absorption of UV by ozone. This variation results in a corresponding change in the pattern of stratospheric winds, which propagates downwards and appreciably influences atmospheric circulation over the North Atlantic basin. Studies using an atmosphere–ocean coupled climate model have shown that solar-induced changes in atmospheric circulation also influence changes of heat storage in North Atlantic Ocean that can integrate and amplify solar effect (Ineson et al., 2011; Scaife et al., 2013). [/quote]

https://www.researchgate.net/public...ew_insights_from_W_coast_Portuguese_estuaries

[/quote]Understanding the Sun-Earth’s climate coupling system is both an essential and an urgent issue, with great progress achieved over the last decades (e.g., Haigh, 2007; Soon et al., 2014 for a review). Recently, Brugnara et al. (2013) referred that the Euro–Atlantic sector, in which Portugal is located, seems to be a region with a particularly strong solar influence on the troposphere, finding a significant change in the mean late winter circulation over Europe, which culminates in detectable impacts on the near-surface climate. Jiang et al. (2015) suggested that (i) climate in the northern North Atlantic regions follows SA [solar activity] fluctuations on multidecadal to centennial time scales, and (ii) it is more susceptible to the influence of those fluctuations throughout cool periods with, for instance, less vigorous ocean circulation. Similar results were found by Gómez-Navarro et al. (2012) in the context of climate simulations for the second millennium over the Iberian Peninsula, recognizing that temperature and precipitation variability is significantly affected at centennial time scales by variations in the SA [solar activity]. … Grand Minima and Dalton-type Minimum scenarios are broadly characterized by (i) lower TSI (i.e., lower available PAR) (Lean, 1991, and references therein), (ii) development of cloudiness (e.g., Usoskin and Kovaltsov, 2008), and (iii) decreased global/regional air surface temperatures (e.g., Neukom et al., 2014) in tandem with greater regional precipitation variability.[/quote]

These are just a few papers...most published in 2017....there are literally dozens of papers mostly published within the past couple of years showing how changes in solar activity drive not only temperature but storm activity, clouds, ozone, sea ice, crop yields, and precipitation changes. The sun is in charge and the climate follows variations in the sun's output. The greenhouse hypothesis and its bastard child the AGW hypothesis are on the way out. As I said, there isn't a single shred of observed, measured, quantified evidence that supports the AGW hypothesis over natural variability.
 
The only thing I can say is, "Pictures from 1400 to 1800"? There are no pictures from then. We didn't even have a workable camera until the early mid 1800's.

Remember when Joe Biden said FDR was on TV in 1929 calming the country over the stock market crash?

 
Though solar activity certainly and demonstratively has effect on our planet it is not as important to our life form as atmosphere at this point. Granted climate must adjust to solar radiation and it will cause some level of disruption, but changes in atmospheric composition are relatively immediate (see Pinatubo) and ocean current changes due to warming are extreme in their climate impacts.
If our planet does indeed enter an "Ice Age" it will probably be the result of the Atlantic conveyor faltering or slowing and thus Northern latitudes losing the equatorial heating. If this happens we will slip into a new "Little Ice Age" due to climate change.

Solar activity doesn't just have an "effect"...it drives our climate, and very small changes in solar activity spell quite large changes in our climate. CO2 is a political issue, and the claims that CO2 has an effect on our climate are political claims not backed up by the first piece of observed, measured, quantified evidence that supports the AGW hypothesis over natural variability...

Research...actual science, is however beginning to wake up to the fact that it is the sun that determines the climate on planet earth and which direction it moves, and by how much....snip...


.
[/QUOTE]

Posting cherry picked graphs and statements by others does not make you seem in any way more informed or capable of understanding this complex and intricate interaction between our star and the planet. I am well aware of solar influences and the ways in which solar radiation impact Earths Atmosphere/Climate. Judging by the pieces you chose to support your stance you either do not grasp what you pretend to know, or you are being purposefully ignorant.
I could very well provide links and articles that debunk what you are trying to get across, but doing so would require the use of papers you are unlikely to understand and would also be a waste of time on someone lacking the base understanding required to reply adequately. Basically, your attempt at representing yourself as competent in this subject is a pretty major fail.

I love it when dupes pretend to be intellectually superior. If you believe that anything other than the energy from the sun and the mass of the atmosphere itself determines the temperature, and in turn the climate on planet earth, you are indeed a top shelf dupe.

But hey, step on up hotrod and show me a single piece of observed, measured, quantified data that supports the AGW hypothesis over natural variability.

By the way goob...did you note that damned near every study I provided was published in 2017? hardly cherrypicking. The fact is that at long last science is beginning to wake up to the AGW scam and in a move of self defense is starting to put that rubbish to bed rather than see all of science tarnished by a few politically motivated hucksters.
 
Posting cherry picked graphs and statements by others does not make you seem in any way more informed or capable of understanding this complex and intricate interaction between our star and the planet. I am well aware of solar influences and the ways in which solar radiation impact Earths Atmosphere/Climate. Judging by the pieces you chose to support your stance you either do not grasp what you pretend to know, or you are being purposefully ignorant.
I could very well provide links and articles that debunk what you are trying to get across, but doing so would require the use of papers you are unlikely to understand and would also be a waste of time on someone lacking the base understanding required to reply adequately. Basically, your attempt at representing yourself as competent in this subject is a pretty major fail.
Have A Nice Day:banghead:

I love it when dupes pretend to be intellectually superior. If you believe that anything other than the energy from the sun and the mass of the atmosphere itself determines the temperature, and in turn the climate on planet earth, you are indeed a top shelf dupe.

But hey, step on up hotrod and show me a single piece of observed, measured, quantified data that supports the AGW hypothesis over natural variability.
By the way goob...did you note that damned near every study I provided was published in 2017? hardly cherrypicking. The fact is that at long last science is beginning to wake up to the AGW scam and in a move of self defense is starting to put that rubbish to bed rather than see all of science tarnished by a few politically motivated hucksters.
 
Cool high pressure is moving into midatlantic and as it moves out it will open up the eastern seaboard for something tropical. Be on the lookout for the 7-10 day
Got going a bit earlier but good call. System has developed off Sc/ga coastline and is already displaying an eye characteristic. Gotta watch this for further development and the track-will it move north or northeast?
The high I talked about is strong so that will aid the easterly flow and winds
Would not be surprised to see mouth of the Chesapeake bay experience 50mph winds or gusts and even D.C. Gets some 15-20 sustained with gusts to 30. These values do not anticipate unexpected strengthening but that has to be a consideration to watch
 
See SSDD's graph from "Blaauw 2017" there? That was published in an open-access journal that accepts just about anything, with Blaauw himself having no other papers of any sort published. That's the kind of 'science' that SSDD pulls from.

Hs other stuff? Some of the same vanity journal crap, and the rest ripped screaming out of context.

 
Last edited:
Mr. Westwall has been predicting cooling ever since he started on this board. And every year, he is proven wrong. These people are incapable of learning. They live in an alternative universe where the treasonous fat senile old orange clown never lies, where solar and wind don't work, and water is not wet.
 
Mr. Westwall has been predicting cooling ever since he started on this board. And every year, he is proven wrong. These people are incapable of learning. They live in an alternative universe where the treasonous fat senile old orange clown never lies, where solar and wind don't work, and water is not wet.


Ahhhh..........but that bitter tone screams, "Our side is losing in ePiC fashion!" Which would be accurate. One place it is a certainty that Mr Trump is winning is climate change and energy. In fact, its a slaughter. Just sayin'.............
 
Cool high pressure is moving into midatlantic and as it moves out it will open up the eastern seaboard for something tropical. Be on the lookout for the 7-10 day
Got going a bit earlier but good call. System has developed off Sc/ga coastline and is already displaying an eye characteristic. Gotta watch this for further development and the track-will it move north or northeast?
The high I talked about is strong so that will aid the easterly flow and winds
Would not be surprised to see mouth of the Chesapeake bay experience 50mph winds or gusts and even D.C. Gets some 15-20 sustained with gusts to 30. These values do not anticipate unexpected strengthening but that has to be a consideration to watch
Good call..

The western high is just holding Harvey over Texas. It looked like it was weakening but heat off of the desert reinforced the high pressure. I have never seen two blocking highs in close proximity until now.
 
Even arch-denier Roy Spencer says that SSDDs "it's just the mass of the atmosphere!" theory is loopy.

Why Atmospheric Pressure Cannot Explain the Elevated Surface Temperature of the Earth « Roy Spencer, PhD

If Roy Spencer is debunking your fraud, you know it must be mega-fraud. I suggest SSDD read it, especially the two thought experiments.
Great article. I especially like the part where he said:

"I continue to maintain that the major source of error in global warming predictions based upon the IPCC models is not in the physics of the greenhouse effect, but in the realm of feedbacks: especially, how clouds respond to a warming tendency. All of the 20+ models predict clouds will enhance warming; I believe they will reduce warming.

Unfortunately, determining cloud feedbacks from our observations of the climate system is an exceedingly difficult problem. Even more difficult is publishing any evidence of negative cloud feedback in the peer reviewed literature."
Dr Spencer is correct and this is why all modeling fails to date.
 
[Was watching Science Channel regarding the solar eclipse and a very interesting point was made.
Over the years sunspots have a cycle when there are years when there are many sunspots and years where there are very few if any.
It is called the "Grand Minimum".
Abrupt onset of the Little Ice Age triggered by volcanism and sustained by sea-ice/ocean feedbacks,” published on 31 January 2012
From a comment on the Ice Age Now Post:
From what I see on this page it sounds like the researchers are not aware of what causes the increased volcanic activity and earthquakes in the first place. Namely a very weak solar cycle is directly linked to a substantial increase in volcanic activity. The “experts” are still having a hard time connecting the dots.
The Next Grand Minimum
View attachment 145286
Notice the period from 1400 to 1800 known as the "little Ice Age"...
Here are some pictures from that time that the Thames river froze over.
When has the Thames froze over?
In the 200 years that have elapsed since, the Thames has never frozen solid enough for such hedonism to be repeated. But between 1309 and 1814, the Thames froze at least 23 times and on five of these occasions -1683-4, 1716, 1739-40, 1789 and 1814 - the ice was thick enough to hold a fair.Jan 28, 2014
View attachment 145288

This cooling will not be enough to offset global warming. And when it's done, the globe will be hotter again and still warming.
 
See SSDD's graph from "Blaauw 2017" there? That was published in an open-access journal that accepts just about anything, with Blaauw himself having no other papers of any sort published. That's the kind of 'science' that SSDD pulls from.

Hs other stuff? Some of the same vanity journal crap, and the rest ripped screaming out of context.


The same scientists who did the research to produce that chart are confident that our emissions are the primary driver of current global warming, not the change in Solar input.
 
Back
Top Bottom