I say again
You [SSDD] are the liar.
Thousands of peer reviewed papers, filled with empirical evidence, have been published over the last few decades that nearly universally provide evidence that global warming is real and is being caused primarily by human GHG emissions and deforestation.
I reject the work of thousands of scientists over decades of research and study because of...
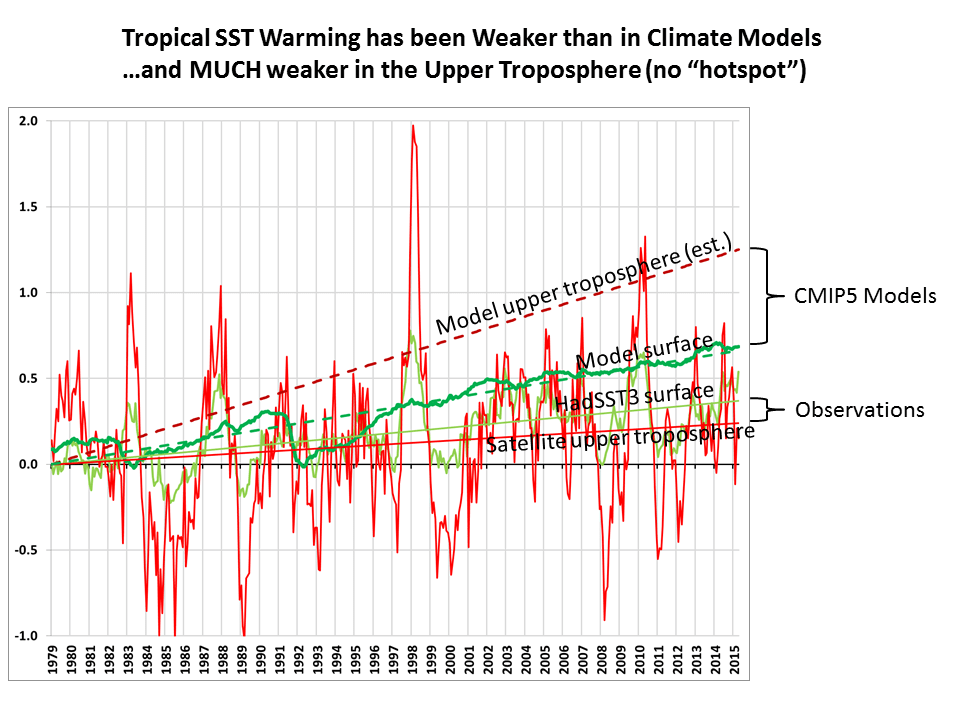
"One of the most vivid predictions of global warming theory is a “hotspot” in the tropical upper troposphere, where increased tropical convection responding to warming sea surface temperatures (SSTs) is supposed to cause enhanced warming in the upper troposphere.
The trouble is that radiosonde (weather ballons) and satellites have failed to show evidence of a hotspot forming in recent decades. Instead, upper tropospheric warming approximately the same as surface warming has been observed...."
"...Note that the linear warming trend in the UT product (+0.07 C/decade, bright red trend line) is less than the HadSST3 sea surface temperature trend (light green, +0.10 C/decade) for the same 20N-20S latitude band, whereas theory would suggest it should be about twice as large (+0.20 C/decade).
And what is really striking in the above plot is how strong the climate models’ average warming trend over the tropical oceans is in the upper troposphere (+0.35 C/decade, dark red), which I calculate to be about 1.89 times the models’ average surface trend (+0.19 C/decade, dark green). This ratio of 1.89 is based upon the UT weighting function applied to the model average temperature trend profile from the surface to 100 mb (16 km) altitude.
So, what we see is that the models are off by about a factor of 2 on surface warming, but maybe by a factor of 5 (!) for upper tropospheric warming.
This is all preliminary, of course, since we still must submit our Version 6 paper for publication. So, make of it what you will.
But I am increasingly convinced that the hotspot really has gone missing. And the reason why (I still believe) is most likely related to water vapor feedback and precipitation processes, which largely govern the total heat budget of the free-troposphere (the layer above the turbulently mixed boundary layer).
I believe the missing hotspot is indirect evidence that upper tropospheric water vapor is not increasing, and so upper tropospheric water vapor (
the most important layer for water vapor feedback) is not amplifying warming from increasing CO2. The fact that UT warming is indeed amplified — by about a factor of 2 — during El Nino events in the above plot might be related to the relatively short time scales involved, since convective heating and radiative cooling are far out of balance during short term variations, but are much closer to being balanced in the long-term with global warming.
The lack of positive water vapor feedback is an especially controversial assertion to make, given that (1) SSM/I satellite measurements of water vapor have
indeed been increasing in lock-step with SST warming, and (2) probably a unanimous opinion in the IPCC climate community that water vapor feedback is positive.
But the SSM/I measurements are largely insensitive to the very low levels of upper tropospheric water vapor, so they can’t tell us anything about upper tropospheric vapor. And while lower-tropospherc water vapor is governed mostly by SST, upper tropospheric vapor is governed by precipitation processes, and we don’t even understand how those might change with warming, let alone have those physics included in climate models.
Instead, I suspect the models have been adjusted so that precipitation systems detrain more water vapor into the upper troposphere with warming, simply because that’s what we see on short time scales, say during El Nino events, and so the convective parameterizations in the models are adjusted to meet that expectation..."
New Satellite Upper Troposphere Product: Still No Tropical “Hotspot” « Roy Spencer, PhD
And this...
Global Warming : Feature Articles
Which shows that our TEMPERATURE today is still within the normal range of an interglacial cycle and that during interglacial cycles there is a saw tooth behavior of temperatures where the temperature can fall and then increase just like we have seen for the past 1000 years.
Wow... doesn't that look like we have a problem!!!!
Not really. It is all part of a natural cycle that has been occurring for the past 400,000 years.
And this...
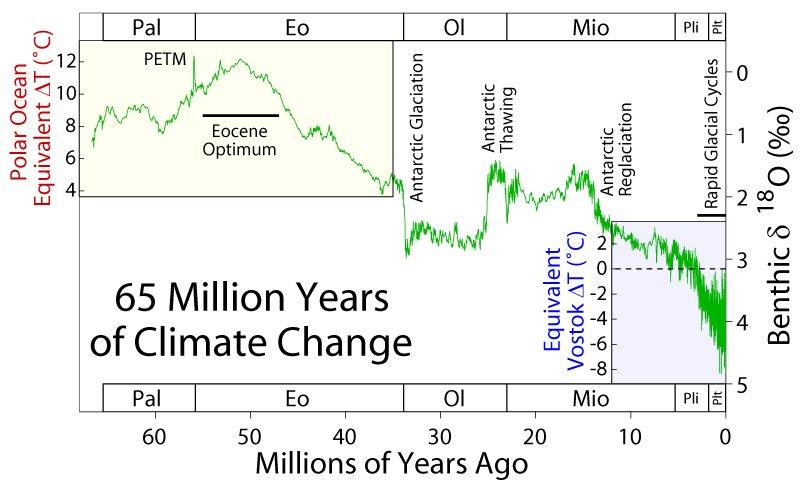
Which shows that the modern world we live in is an icehouse and that it is geologically speaking rare.
The world we live in today is an icehouse world. It is characterized by bipolar glaciation.
We think of this as normal, but it's not. For most of the past 55 million years our planet was a greenhouse world.
Bipolar glaciation is geologically rare, possibly unique. No other previous instance of bipolar glaciation has been recorded in the geologic record.
The icehouse world we live in today is characterized by glacial - interglacial cycles and a high latitudinal thermal gradient.
The modern icehouse world we live in today differed strongly from the greenhouse world in that the greenhouse world did not have bipolar glaciation and had a low latitude thermal gradient.
And this...
Which explains the trigger for the glacial and interglacial cycles.
And this...
Which explains the conditions necessary for the glacial-interglacial cycles were our poles being isolated from warm marine currents and atmospheric CO2.
The oxygen isotope curve is well established for the Cenozoic and shows that the trend is for a COOLING earth. Over the last 5 million years there has been rapid cooling.
Climate models predict that extensive glaciation cannot occur at the South Pole until atmospheric CO2 reaches 750 ppm. Climate models predict that extensive glaciation cannot occur at the North Pole until atmospheric CO2 reaches 250 ppm.
Five million years ago the earth started going through glacial / interglacial cycles. The glacial / interglacial cycles of the past 3 million years were triggered by Milankovitch cycles. But before the glacial cycle could be triggered, two conditions needed to be met; the north and south poles had to be isolated from warm marine currents and atmospheric CO2 needed to be 400 ppm or less. These conditions still exist today.
The north pole is isolated by landmasses. The south pole is isolated because of Antarctica.
And this...
Which establishes that EXTENSIVE northern hemisphere glaciation cannot occur until 280 ppm but EXTENSIVE Antarctic glaciation occurs at 750 ppm.
For major bipolar glaciation to have occurred at Oi-1, CO2 would first have to cross the Antarctic glaciation threshold (,750 p.p.m.v.) and then fall more than 400 p.p.m.v. within ,200 kyr to reach the Northern Hemisphere threshold (Fig. 4). Increased sea ice and upwelling in the Southern Ocean 13,29 and falling sea level 14 could have acted as feedbacks accelerating CO2 drawdown at the time of Oi-1.This is supported by CO2 proxy records and carbon-cycle model results showing a drop in CO2 across the Eocene/Oligocene transition10,13,14, but none of these reconstructions reach the low levels required for Northern Hemisphere glaciation. We therefore conclude that major bipolar glaciation at the Eocene/Oligocene transition is unlikely, and Mg/Ca-based estimates of deep-sea temperatures across the boundary 5 are unreliable. Our findings lend support to the hypothesis that the 1-km deepening of the carbonate compensation depth and the associated carbonate ion effect on deep-water calcite mask a cooling signal in the Mg/Ca records 4,5. Therefore, the observed isotope shift at Oi-1 is best explained by Antarctic glaciation 22 accompanied by 4.0 uC of cooling in the deep sea or slightly less (,3.3 uC) if there was additional ice growth on West Antarctica (see Methods and Supplementary Information). This explanation is in better agreement with sequence stratigraphic estimates of sea-level fall at Oi-1(70 620 m)19,20 equivalent to 70–120% of modern Antarctic ice volume, and coupled GCM/ice-sheet simulations showing 2–5 uC cooling and expanding sea ice in the Southern Ocean in response to Antarctic glaciation 29. Additional support for ocean cooling is provided by new records from Tanzania 16 and the Gulf of Mexico 15, where Mg/Ca temperature estimates show ,2.5 uC cooling in shallow, continental shelf settings during the first step of the Eocene/Oligocene transition.
In summary, our model results show that the Northern Hemisphere contained glaciers and small, isolated ice caps in high elevations through much of the Cenozoic, especially during favourable orbital periods (Fig. 3a–c). However, major continental-scale Northern Hemisphere glaciation at or before the Oi-1 event (33.6Myr) is unlikely, in keeping with recently published high-resolution Eocene no definitive evidence of widespread northern-hemispheric glaciation exists before ,2.7 Myr ago, pre-Pliocene records from subsequently glaciated high northern latitudes are generally lacking. More highly resolved CO2 records focusing on specific events, along with additional geological information from high northern latitudes, will help to unravel the Cenozoic evolution of the cryosphere. According to these results, this evolution may have included an episodic northern-hemispheric ice component for the past 23 million years.
Thresholds for Cenozoic bipolar glaciation
And this...
Which shows that:
1. The temperature fell 10 million years ago while CO2 was increasing.
2. Antarctic thawing occurred while CO2 values dropped at the OI/Mio transition and never fell below levels of the OI.
3. The glacial-interglacial cycles of the past 500,000 years began while atmospheric CO2 was greater than 400 ppm.
4. It took 12 million years for the temperature to fall to the temperature predicted by radiative forcing of CO2.