CrusaderFrank
Diamond Member
- May 20, 2009
- 163,640
- 90,218
- 2,645
Global Warming is turning the oceans acidic! 30%!! Amiright?
Follow along with the video below to see how to install our site as a web app on your home screen.
Note: This feature may not be available in some browsers.
Every single Scientific Society, every single National Academy of Science, and every major University in the world states that AGW is a fact, and that it represents a clear and present danger. Any yet you deny that it exists.
On what basis? Faith? Seems like you are projecting your own ignorance and cupidity.
Every scientific society, National Academy of science, and major university in the world once stated that it was scientific fact that the earth was flat.
The data didnt support them. It doesnt support you.
More recently in the 70's these same Societies were convinced the Danger was a New Ice Age,
oh and to claim every Society and Academy agrees there is "a clear and present Danger" is not True. They may all agree on the Basic Idea of Warming, There is wide differences of Opinion on how it will effect us, and how soon.
Just because you refuse to read it does not mean it hasn't already been posted!!!!!I still haven't read any refutation or explanation of the following:
"The number of [Siberian ]stations increased from 8 in 1901 to 23 in 1951 and then decreased to 12 from 1989 to present Only four stations, those at Irkutsk, Bratsk, Chita and Kirensk, cover the entire 20th century.
IEA analysts say climatologists use the data of stations located in large populated centers that are influenced by the urban-warming effect more frequently than the correct data of remote stations
The scale of global warming was exaggerated due to temperature distortions for Russia accounting
for 12.5% of the worlds land mass. The IEA said it was necessary to recalculate all global-temperature data in order to assess the scale of such exaggeration.
Climategatekeeping: Siberia « Climate Audit
View attachment 19980
View attachment 19981
View attachment 19982
Global Temperatures
Climate Audit bitched about stations being near heat sources and their data should be removed and when the stations were removed as demanded Climate Audit then bitched about the reduced number of stations!!!!
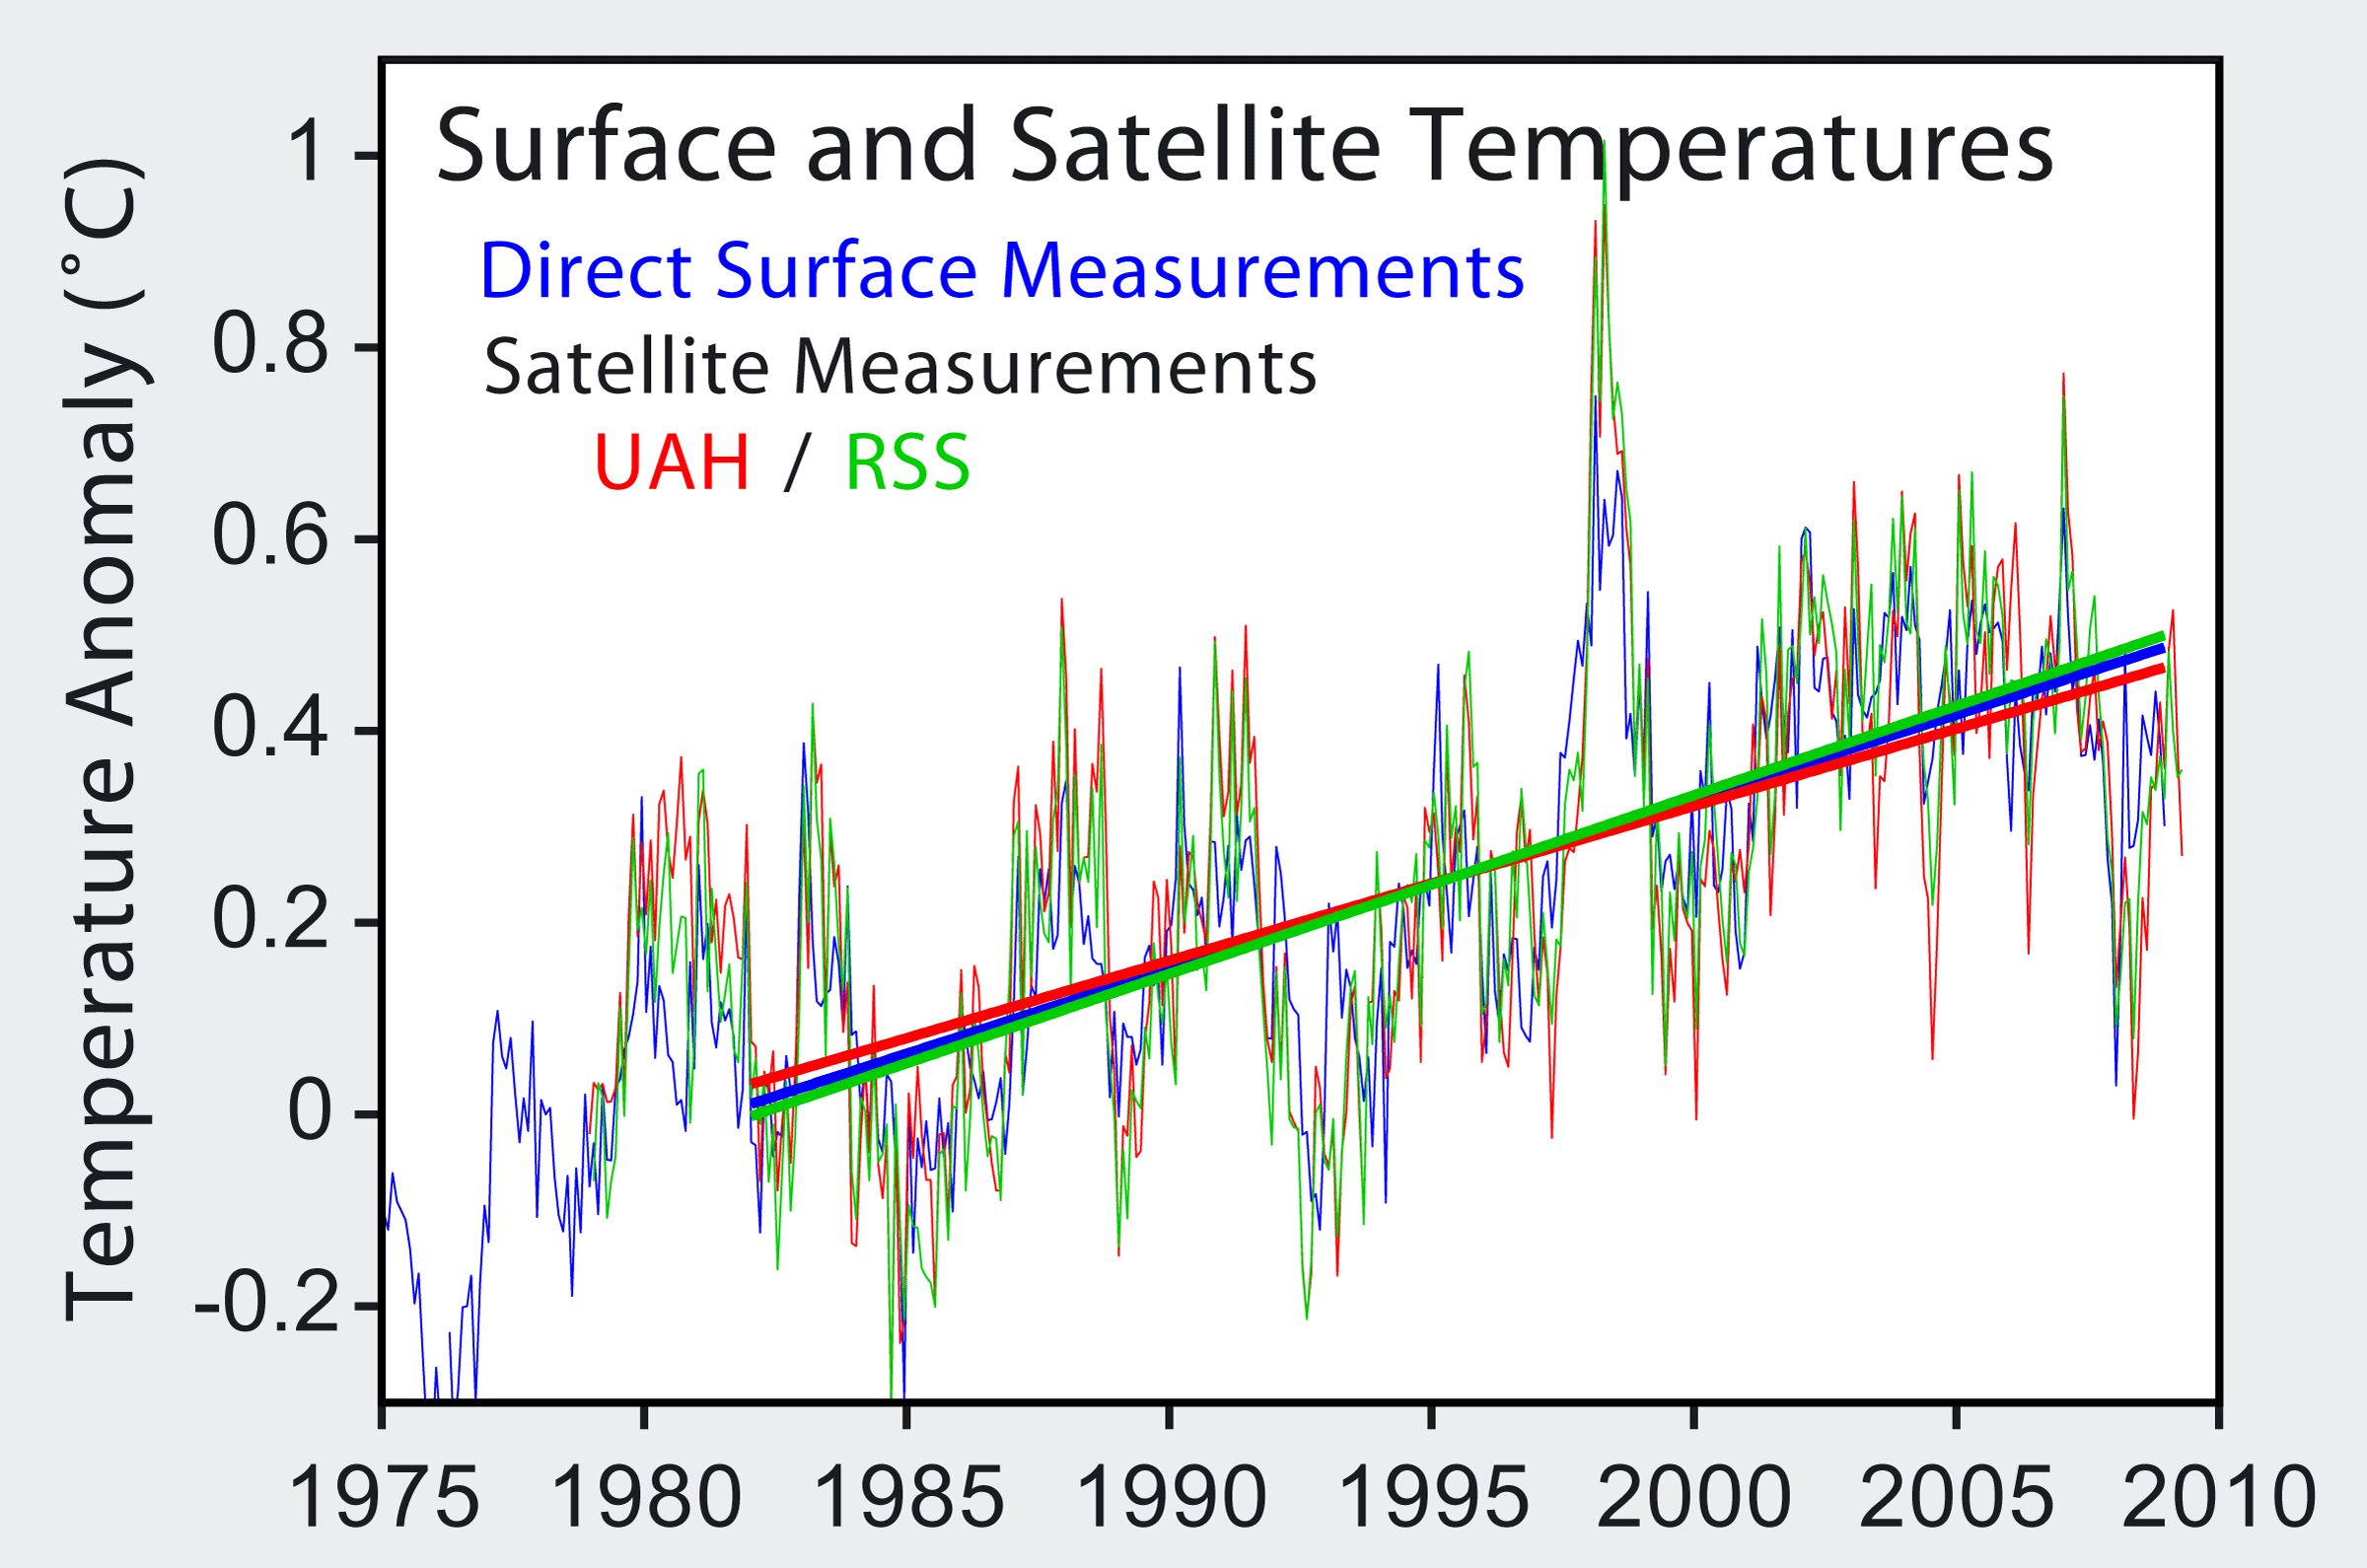
The fact remains, as previously posted, that satellites are not near heat sources and read the whole globe and they match the ground stations almost exactly.
Translation: UAH can't fudge the data by using the opposite sign to compensate for diurnal satellite drift like they used to, so they came up with new bullshit to lower the the warming trend. But even cooking the data by 30% UAH still have a warming trend almost identical to the RSS satellite data and the ground stations. There are no heat sources in space to throw satellite readings off, so there is no need to remove 30% of the warming trend.More recently in the 70's these same Societies were convinced the Danger was a New Ice Age,
oh and to claim every Society and Academy agrees there is "a clear and present Danger" is not True. They may all agree on the Basic Idea of Warming, There is wide differences of Opinion on how it will effect us, and how soon.
Just because you refuse to read it does not mean it hasn't already been posted!!!!!I still haven't read any refutation or explanation of the following:
"The number of [Siberian ]stations increased from 8 in 1901 to 23 in 1951 and then decreased to 12 from 1989 to present Only four stations, those at Irkutsk, Bratsk, Chita and Kirensk, cover the entire 20th century.
IEA analysts say climatologists use the data of stations located in large populated centers that are influenced by the urban-warming effect more frequently than the correct data of remote stations
The scale of global warming was exaggerated due to temperature distortions for Russia accounting
for 12.5% of the worlds land mass. The IEA said it was necessary to recalculate all global-temperature data in order to assess the scale of such exaggeration.
Climategatekeeping: Siberia « Climate Audit
View attachment 19980
View attachment 19981
View attachment 19982
Global Temperatures
Climate Audit bitched about stations being near heat sources and their data should be removed and when the stations were removed as demanded Climate Audit then bitched about the reduced number of stations!!!!
The fact remains, as previously posted, that satellites are not near heat sources and read the whole globe and they match the ground stations almost exactly.
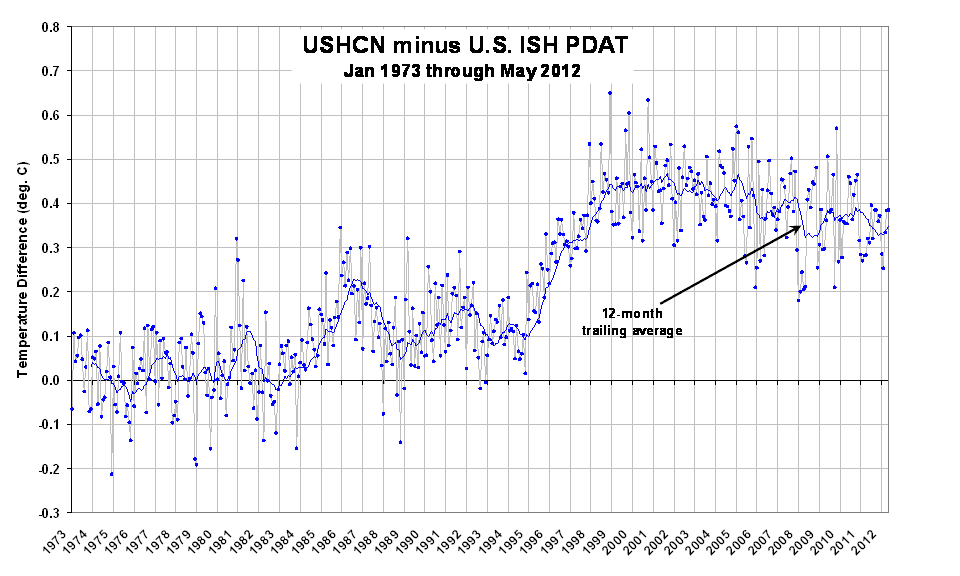
I'm pleased that you are using the UAH surface data which is prepared WITHOUT a lot of the arbitrary "corrections". UAH DOES USE a population density control method for "heat island" that removes up to 30% of the warming trend shown in OTHER data preps.
Compare that slope to the OFFICIAL US record and you'll see where the fraud has been perpetrated.
Also -- Then why is it Mr. Cynic -- that Hansen and the NASA folks SHUN the satellite data in favor of 12,000 thermometers?? Why it's because it DOESN'T agree with their cooked data preps...
Translation: UAH can't fudge the data by using the opposite sign to compensate for diurnal satellite drift like they used to, so they came up with new bullshit to lower the the warming trend. But even cooking the data by 30% UAH still have a warming trend almost identical to the RSS satellite data and the ground stations. There are no heat sources in space to throw satellite readings off, so there is no need to remove 30% of the warming trend.Just because you refuse to read it does not mean it hasn't already been posted!!!!!
Climate Audit bitched about stations being near heat sources and their data should be removed and when the stations were removed as demanded Climate Audit then bitched about the reduced number of stations!!!!
The fact remains, as previously posted, that satellites are not near heat sources and read the whole globe and they match the ground stations almost exactly.
I'm pleased that you are using the UAH surface data which is prepared WITHOUT a lot of the arbitrary "corrections". UAH DOES USE a population density control method for "heat island" that removes up to 30% of the warming trend shown in OTHER data preps.
Compare that slope to the OFFICIAL US record and you'll see where the fraud has been perpetrated.
Also -- Then why is it Mr. Cynic -- that Hansen and the NASA folks SHUN the satellite data in favor of 12,000 thermometers?? Why it's because it DOESN'T agree with their cooked data preps...
To say you have to deduct 30% of the warming trend due to the population is to admit that at least 30% of the warming trend is CAUSED BY HUMANS!!!!!!!!!!!!!
Thank you!
Duh sphereists told me duh Ert wuz a round fuker, so I went over dere, an duh Ert wuz still flat, some more, even! Fuking Obama. Goddam Gore. WTF, religun. Dunno, sciyunce. Splain how to say assid some mo, bout duh see levul. One mo time.
Duh Ert iz pounded FLAT-FLAT-FLAT, for Jezus, on duh CROSS. Religun. Sciyunce. WTF!
How many lobotomies have you had?
I mean so far for today?
Duh sphereists told me duh Ert wuz a round fuker, so I went over dere, an duh Ert wuz still flat, some more, even! Fuking Obama. Goddam Gore. WTF, religun. Dunno, sciyunce. Splain how to say assid some mo, bout duh see levul. One mo time.
Duh Ert iz pounded FLAT-FLAT-FLAT, for Jezus, on duh CROSS. Religun. Sciyunce. WTF!

Yes, once the data is manipulated.Every scientific society, National Academy of science, and major university in the world once stated that it was scientific fact that the earth was flat.
The data didnt support them. It doesnt support you.
More recently in the 70's these same Societies were convinced the Danger was a New Ice Age,
oh and to claim every Society and Academy agrees there is "a clear and present Danger" is not True. They may all agree on the Basic Idea of Warming, There is wide differences of Opinion on how it will effect us, and how soon.
Just because you refuse to read it does not mean it hasn't already been posted!!!!!I still haven't read any refutation or explanation of the following:
"The number of [Siberian ]stations increased from 8 in 1901 to 23 in 1951 and then decreased to 12 from 1989 to present Only four stations, those at Irkutsk, Bratsk, Chita and Kirensk, cover the entire 20th century.
IEA analysts say climatologists use the data of stations located in large populated centers that are influenced by the urban-warming effect more frequently than the correct data of remote stations
The scale of global warming was exaggerated due to temperature distortions for Russia accounting
for 12.5% of the worlds land mass. The IEA said it was necessary to recalculate all global-temperature data in order to assess the scale of such exaggeration.
Climategatekeeping: Siberia « Climate Audit
View attachment 19980
View attachment 19981
View attachment 19982
Global Temperatures
Climate Audit bitched about stations being near heat sources and their data should be removed and when the stations were removed as demanded Climate Audit then bitched about the reduced number of stations!!!!
The fact remains, as previously posted, that satellites are not near heat sources and read the whole globe and they match the ground stations almost exactly.
This says it all! Here is an excerpt from Hansens latest plea for help. This sort of verbiage only exists in the minds of the mentally challenged.i
"The precision achieved by the most advanced generation of radiation budget satellites is indicated by the planetary energy imbalance measured by the ongoing CERES (Clouds and the Earths Radiant Energy System) instrument (Loeb et al., 2009), which finds a measured 5-year-mean imbalance of 6.5 W/m2 (Loeb et al., 2009). Because this result is implausible, instrumentation calibration factors were introduced to reduce the imbalance to the imbalance suggested by climate models, 0.85 W/m2 (Loeb et al., 2009)."
http://pubs.giss.nasa.gov/docs/notyet/submitted_Hansen_etal.pdf
Yeah, the more dense the population the more human caused warming, and deniers can't allow that so just subtract 30% for the existence of people and whalla, no more human caused global warming.Translation: UAH can't fudge the data by using the opposite sign to compensate for diurnal satellite drift like they used to, so they came up with new bullshit to lower the the warming trend. But even cooking the data by 30% UAH still have a warming trend almost identical to the RSS satellite data and the ground stations. There are no heat sources in space to throw satellite readings off, so there is no need to remove 30% of the warming trend.I'm pleased that you are using the UAH surface data which is prepared WITHOUT a lot of the arbitrary "corrections". UAH DOES USE a population density control method for "heat island" that removes up to 30% of the warming trend shown in OTHER data preps.
Compare that slope to the OFFICIAL US record and you'll see where the fraud has been perpetrated.
Also -- Then why is it Mr. Cynic -- that Hansen and the NASA folks SHUN the satellite data in favor of 12,000 thermometers?? Why it's because it DOESN'T agree with their cooked data preps...
To say you have to deduct 30% of the warming trend due to the population is to admit that at least 30% of the warming trend is CAUSED BY HUMANS!!!!!!!!!!!!!
Thank you!
Fact is that for the US surface data -- The UAH is a MUCH better match to satellite than Hansen's surface data prep. IN FACT -- Dr. Roy Spencer at UAH constantly POKES the other data with the diff between his prep and theirs shown here..
If you believe that a couple decades of warming occurred in the '96 to '98 time period -- I'll buy you lunch at a steakhouse..
Urban heating and the Greenhouse are two diff things. Humans cause urban heating but it has no effect in an atmosphere that is not retaining additional heat. In other words, it doesn't count to additional Greenhouse effect. That would be a new theory wouldn't it?
Spencer uses a simple population density correction that has been shown to resolve station diffs in urban/rural areas. The official record simply merges the good with the bad to come with a homogenized reading. ((Along with some human intuition))
It makes sense to CORRECT those deficient stations that were built near air vents and in parking lots. NOT shut them down. THAT's why rationale people would question that decision.
and deniers just make shit up!Yes, once the data is manipulated.More recently in the 70's these same Societies were convinced the Danger was a New Ice Age,
oh and to claim every Society and Academy agrees there is "a clear and present Danger" is not True. They may all agree on the Basic Idea of Warming, There is wide differences of Opinion on how it will effect us, and how soon.
Just because you refuse to read it does not mean it hasn't already been posted!!!!!
Climate Audit bitched about stations being near heat sources and their data should be removed and when the stations were removed as demanded Climate Audit then bitched about the reduced number of stations!!!!
The fact remains, as previously posted, that satellites are not near heat sources and read the whole globe and they match the ground stations almost exactly.
This says it all! Here is an excerpt from Hansens latest plea for help. This sort of verbiage only exists in the minds of the mentally challenged.i
"The precision achieved by the most advanced generation of radiation budget satellites is indicated by the planetary energy imbalance measured by the ongoing CERES (Clouds and the Earths Radiant Energy System) instrument (Loeb et al., 2009), which finds a measured 5-year-mean imbalance of 6.5 W/m2 (Loeb et al., 2009). Because this result is implausible, instrumentation calibration factors were introduced to reduce the imbalance to the imbalance suggested by climate models, 0.85 W/m2 (Loeb et al., 2009)."
http://pubs.giss.nasa.gov/docs/notyet/submitted_Hansen_etal.pdf
See that?
Real scientists alter the model to fit the data. Climate scientists alter the data to fit the model.
That is astoundingly bad science.
Yeah, the more dense the population the more human caused warming, and deniers can't allow that so just subtract 30% for the existence of people and whalla, no more human caused global warming.
And as far as the stations near heat sources, the fact that you expect data immediately after the heat source is removed or the station is moved just shows how little you know about data collection at ground stations!!!!!
if you recall, every time the data from a station that was near a heat source was removed, the warming trend INCREASED. That is because they measure anomalies, which are the deviation from the 30 year AVERAGE for THAT PARTICULAR station. So the heat source makes the average the anomaly is measured against abnormally high producing an abnormally low anomaly. Removing the abnormally low anomalies from the data set increases the warming trend. Deceivers like McIntyre have misled you into thinking that the absolute temperature is what is used in the data set, so you stupidly expect removing the heat source to cause the warming trend to go down. You have been had!!!!!
Once the station is relocated you have to collect data for 30 years before you have a new average to measure the anomalies against. That is why the number of usable ground stations in the data set goes down temporarily every tine you make a change with a station.
NCDC: Global Surface Temperature Anomalies
What is a temperature anomaly?
The term temperature anomaly means a departure from a reference value or long-term average. A positive anomaly indicates that the observed temperature was warmer than the reference value, while a negative anomaly indicates that the observed temperature was cooler than the reference value.
I'm sure it comforts your small, frightened mind to pretend that.and deniers just make shit up!Yes, once the data is manipulated.Just because you refuse to read it does not mean it hasn't already been posted!!!!!
Climate Audit bitched about stations being near heat sources and their data should be removed and when the stations were removed as demanded Climate Audit then bitched about the reduced number of stations!!!!
The fact remains, as previously posted, that satellites are not near heat sources and read the whole globe and they match the ground stations almost exactly.
This says it all! Here is an excerpt from Hansens latest plea for help. This sort of verbiage only exists in the minds of the mentally challenged.i
"The precision achieved by the most advanced generation of radiation budget satellites is indicated by the planetary energy imbalance measured by the ongoing CERES (Clouds and the Earths Radiant Energy System) instrument (Loeb et al., 2009), which finds a measured 5-year-mean imbalance of 6.5 W/m2 (Loeb et al., 2009). Because this result is implausible, instrumentation calibration factors were introduced to reduce the imbalance to the imbalance suggested by climate models, 0.85 W/m2 (Loeb et al., 2009)."
http://pubs.giss.nasa.gov/docs/notyet/submitted_Hansen_etal.pdf
See that?
Real scientists alter the model to fit the data. Climate scientists alter the data to fit the model.
That is astoundingly bad science.
That quote did not come from your link, as I'm sure you know since you always check your sources. (SARCASM)
Wherever it came from you can be sure it was taken out of context if not made up entirely. Probably by some known deceiver like Andrew Watts.
'Our results suggest that the large-scale climate reconstruction shown by the Intergovernmental Panel on Climate Change (IPCC) likely underestimate this long-term cooling trend over the past few millennia.

Looks like Watts got caught making shit up again.I'm sure it comforts your small, frightened mind to pretend that.and deniers just make shit up!Yes, once the data is manipulated.
See that?
Real scientists alter the model to fit the data. Climate scientists alter the data to fit the model.
That is astoundingly bad science.
That quote did not come from your link, as I'm sure you know since you always check your sources. (SARCASM)
Wherever it came from you can be sure it was taken out of context if not made up entirely. Probably by some known deceiver like Andrew Watts.
Hansens Arrested Development | Watts Up With That?
James Hansen has taken time off between being arrested to produce another in the list of his publications. Its called Earths Energy Imbalance and Implications. This one is listed as submitted Looks like Hansen altered it before final publication, doesn't it?
- Tree ring study gives first accurate climate reading back to 138BC
- World has been slowly cooling for 2,000 years
- World was warmer in Roman and Medieval times than it is now
- Study of semi-fossilised trees in Finland
'Our results suggest that the large-scale climate reconstruction shown by the Intergovernmental Panel on Climate Change (IPCC) likely underestimate this long-term cooling trend over the past few millennia.
Tree-ring study proves that climate was WARMER in Roman and Medieval times than it is in the modern industrial age | Mail Online
Please dumb ****, you tell us what % of the WORLD'S land mass is Finland?No SHIT? Do you ever go to environment threads, or is this science shit brand new, for you?
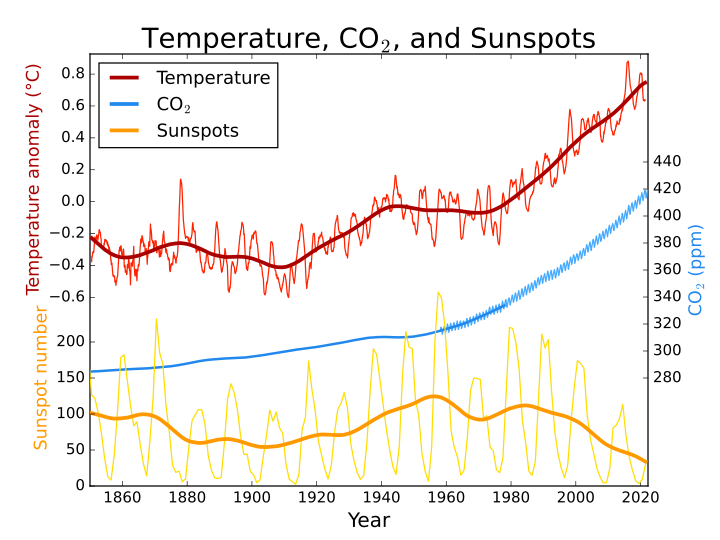
Take a look at the recent trend, of global temperature, since 1880:
Let's go over some more, of this cool scientific shit! It turns out, solar intensity is less, but temperature is going UP. What do you suppose could do THAT?
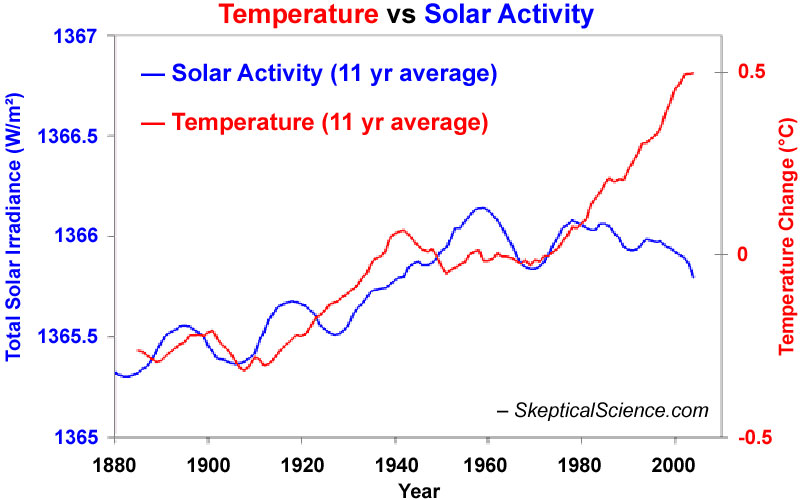
Why, then! CO2 has been going UP, since humans have been clearing forests and burning fossil fuels. But then, humans got CHAINSAWS and CARS, so even though the Earth got less warmth, from the sun, the atmosphere retains more IR radiation, so we are heating the **** UP:
Solar intensity has been relatively low, for the last several decades, our current cycle is cool, but temperature is going UP, and the climate is ******* up, bigtime. I wonder what the **** you are trying to prove, since the next time that sun warms up, we are going right UP, past:
1. the Medieval Warming Period
2. the Roman Warming Period
3. the Minoan Warming Period
4. the Holocene Maximum
5. the Paleocene-Eocene Thermal Maximum
. . . toward the Permian-Triassic Extinction, which our Mass Extinction Event 6 will challenge, for top killer, of ALL GEOLOGIC TIME!! What are you trying to prove, HM?
"Of course you realize all your above temperature readings come from 87.5% of the world's land mass...
The reason I ask is because one of the criticism's of global warming data was
the exclusion over 50 years of data from 12.5% of the world's land mass.
Those readings were for Siberia and when added to the other readings would have
diminished the premise that the earth's temperature was rising.
"The number of [Siberian ]stations increased from 8 in 1901 to 23 in 1951 and
then decreased to 12 from 1989 to present Only four stations,
those at Irkutsk, Bratsk, Chita and Kirensk, cover the entire 20th century.
IEA analysts say climatologists use the data of stations located in large
populated centers that are influenced by the urban-warming effect
more frequently than the correct data of remote stations
The IEA said it was necessary to recalculate all global-temperature data in order
to assess the scale of such exaggeration.
Climategatekeeping: Siberia « Climate Audit
Please dumb f...k explain how YOUR temperature readings ARE NOT higher because Siberian temperatures representing 12.5% of the WORLD's land mass aren't included?
So, Hansen alters his paper before publication...and it' Watts' fault.Looks like Watts got caught making shit up again.I'm sure it comforts your small, frightened mind to pretend that.and deniers just make shit up!
That quote did not come from your link, as I'm sure you know since you always check your sources. (SARCASM)
Wherever it came from you can be sure it was taken out of context if not made up entirely. Probably by some known deceiver like Andrew Watts.
Hansens Arrested Development | Watts Up With That?
James Hansen has taken time off between being arrested to produce another in the list of his publications. Its called Earths Energy Imbalance and Implications. This one is listed as submitted Looks like Hansen altered it before final publication, doesn't it?
From your link;
UPDATE: Some commenters have noted that my article implies that Hansen used those CERES satellite results in the study in question. Hansen did not use them, stating correctly that the uncertainties were too great for his purposes. w.
Seas will go up "several feet"??
We've been warned by your high priest AlGore the melting glaciers will raise the sea levels so his home he recently bought will be under water!
So with 5,773,000,000,000,000,000 (5.7 quintillion gallons in all the Ice caps,Glaciers),..
and it all melted it would add to all the oceans seas, bays with 321 quintillion gallons that would be equal to adding 1.74% to the oceans.
That is equal to adding to a 648,000 gallon Olympic sized pool at 9 feet 10 inches
2 inches!
In Florida the commonly used example, the gulf of Mexico is a depth of less then
100 feet for over 100 miles from shore. 1.74% increase of water due to melting of all glaciers would add 1.7 feet. NOT perceivable nor affecting life much less covering the state!
The total water supply of the world is 326 million cubic miles
(a cubic mile is an imaginary cube (a square box) measuring one mile on each side).
A cubic mile of water equals more than one trillion gallons.
Oceans, Seas, & Bays 321,000,000 1,338,000,000 -- 96.5
Ice caps, Glaciers, & Permanent Snow 5,773,000 24,064,000 68.7 1.74
Ground water 5,614,000 23,400,000 -- 1.7
Fresh 2,526,000 10,530,000 30.1 0.76
Saline 3,088,000 12,870,000 -- 0.94
Soil Moisture 3,959 16,500 0.05 0.001
Ground Ice & Permafrost 71,970 300,000 0.86 0.022
Lakes 42,320 176,400 -- 0.013
Fresh 21,830 91,000 0.26 0.007
Saline 20,490 85,400 -- 0.006
Atmosphere 3,095 12,900 0.04 0.001
Swamp Water 2,752 11,470 0.03 0.0008
Rivers 509 2,120 0.006 0.0002
Biological Water 269 1,120 0.003 0.0001
Seems like I have answered this dumb **** post before. The average depth of the ocean is 14,000 ft.
How deep is the ocean?
So adding 1.7% more water to that would be around 250 ft to the sea level. Significant indeed. That would put about 170 feet of salt water over the roof of my house in Portland Oregon. There would not be much of Florida left.
Really be too much to expect of you dumb **** 'Conservatives' to do a bit of research before you make asses of yourself.
You should heed your own advice, Moldy Socks.
According to the national snow and ice data center, about 99% of all fresh water ice on earth is in the combination of Antarctica and Greenland icesheets. Quick Facts on Ice Sheets
Quick Facts on Ice SheetsAn ice sheet is a mass of glacial land ice extending more than 50,000 square kilometers (20,000 square miles). The two ice sheets on Earth today cover most of Greenland and Antarctica. During the last ice age, ice sheets also covered much of North America and Scandinavia.
Together, the Antarctic and Greenland ice sheets contain more than 99 percent of the freshwater ice on Earth. The Antarctic Ice Sheet extends almost 14 million square kilometers (5.4 million square miles), roughly the area of the contiguous United States and Mexico combined. The Antarctic Ice Sheet contains 30 million cubic kilometers (7.2 million cubic miles) of ice. The Greenland Ice Sheet extends about 1.7 million square kilometers (656,000 square miles), covering most of the island of Greenland, three times the size of Texas.
That's 66 feet.
While not insignificant, it's a DAMN far stretch from Moldy Socks' faked-up numbers, which he rounded up by the way.
Now, what is the ******* chance that the temperature in Antarctica will rise sufficiently to permit that much melting?
Effectively NONE.-- HowStuffWorks "If the polar ice caps melted, how much would the oceans rise?"the average temperature in Antarctica is -37°C, so the ice there is in no danger of melting. In fact in most parts of the continent it never gets above freezing.
