In case you haven't noticed, there is a 100% economic fail rate in Progressive, re-distributive economics. It has failed everywhere its been tried, it has failed every single time its been tried. It's such an abject failure that even real Communists in China and Vietnam have recognized it as such and have openly embraced Free Markets as a path to prosperity.
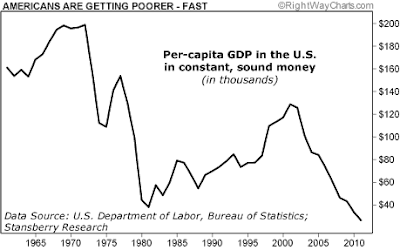
I came across the following chart that clearly shows how Progressive (Socialist, Marxist) economics fails even in America. Since the "War on Poverty" (the exit strategy seems to be: we won't stop fighting until every American is in poverty). You can clearly see how destructive Progressive economics is. The only respite was during the Reagan boom and then, we had the misfortune to elect a "Compassionate Conservative" who blew the best chance to turn us away from the destructive path Progressive have put us on.
Running 'Cause I Can't Fly: Porter Stansberry, "The Corruption of America"
Thoughts? Comments?
I skimmed it but it doesn't appear to be very substantive. I doubt many people would believe we are no better off than we were in 1980.
The methodology assumes it has a better calculation of purchasing power by using commodities as a barometer for "real" value of currencies. That, of course, is ridiculous, because if you study commodities you know that commodity markets go through long booms and busts. Commodities as a group barely earn any real return over many decades. However, they can have 10-20 year structural bull and bear markets. It also makes the assumption of no changes in fundamental supply and demand, which you'd have to isolate from the monetary affects. That's silly. China sucks up something like half of the world's iron ore, up about 10x from a decade ago. Chinese oil consumption has risen from 4 million barrels a day to 8 million in a decade. Of course, that has an enormous affect on the price of oil. So its hard to take seriously.
Also, they makes some very dubious statements. For example, the authors say
Consider, for example, annual sales of automobiles. Auto sales peaked in 1985 (11 million) and have been declining at a fairly steady rate since 1999. In 2009, Americans bought just 5.4 million passenger cars.
But that excludes leases and light truck sales. If you include both, there were 14.6 million sales and leases, which is the same as 1990 but down from 20 million a few years earlier, the decline occurring because of the deepest economic downturn in 80 years. This isn't permanent. It is cyclical.
RITA | BTS | Table 1-17: New and Used Passenger Car Sales and Leases
So the methodology is bad and its best to dismiss it.