ScienceRocks
Democrat all the way!
- Banned
- #1
Swanson Tsonis variability
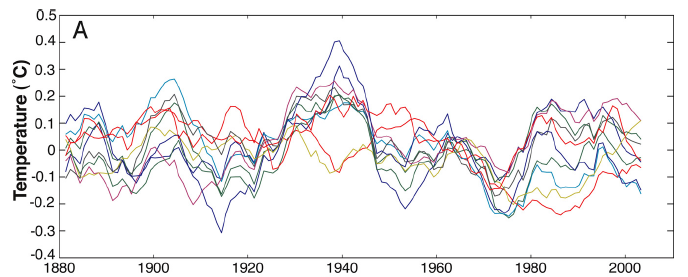
Figure 1: Estimation of the observed signature of internal variability in the observed 20th century global mean temperature in climate model simulations
As you can see, over periods of a few decades, modeled internal variability does not cause surface temperatures to change by more than 0.3°C, and over longer periods, such as the entire 20th Century, its transient warming and cooling influences tend to average out, and internal variability does not cause long-term temperature trends.
"The amplitude and time scale of the IMP [internal multidecadal pattern] are such that its contribution to the trend dominates that of the forced component on time scales shorter than 16 yr, implying that the lack of warming trend during the past 10 yr is not statistically significant...While the IMP can contribute significantly to trends for periods of 30 yr or shorter, it cannot account for the 0.8°C warming that has been observed in the twentieth-century spatially averaged SST."
This conclusion directly contradicts the statement that natural variability can account for all of the recent warming. This is not a new finding, as it is consistent for example with Stouffer et al. (1994):
"throughout the simulated time series no temperature change as large as 0.5°C per century is sustained for more than a few decades. Assuming that the model is realistic, these results suggest that the observed trend is not a natural feature of the interaction between the atmosphere and oceans."
and with Wigley and Raper (1990):
"Simulations with a simple climate model are used to determine the main controls on internally generated low-frequency variability, and show that natural trends of up to 0.3°C may occur over intervals of up to 100 years. Although the magnitude of such trends is unexpectedly large, it is insufficient to explain the observed global warming during the twentieth century"
---PEOPLE THIS IS WITH THE TSI FROM THE SUN---You can clearly see how it peaked in 1950 and has been slowly moving downwards with the internal movers.
It's internal variability