That's your delusion because you're the fool. Scientists know better. Even scientists who dispute AGW know better.
Dr. Roy Spencer who runs the satellite monitoring program at the University of Alabama Huntsville, is a skeptic of AGW, one of the very few actual climate scientists who's still skeptical, and here's what he has to say about CO2 and the greenhouse effect.
And yet, he can't offer up any proof that he is right. He has attempted experiments to prove backradiation but they have all failed. He states that he believes it even though he can't prove it.
The greenhouse effect is supported by laboratory measurements of the radiative absorption properties of different gases, which when put into a radiative transfer model that conserves energy, and combined with convective overturning of the atmosphere in response to solar heating, results in a vertical temperature profile that looks very much like the one we observe in nature.
***
Translate = models tell us it is true so it must be true. There is no proof there. All that statement says is that your "scientists" have faith in models and we all know that the models are notoriously inaccurate.
By the way, the vertical temperature profile produced by models your "scientist" speaks of is not at all like the vertical temperature profile observed in nature as evidenced by the missing hot spot that all models predict.
I also want to add this, which I spotted in another quote here and then we shall address both statements here, and place the cross-hairs squarely on target, all You have to do is squeeze the trigger afterwards...
How Well Do Coupled Models Simulate Today's Climate?
Bulletin of the American Meteorological Society
March 2008
Dr. Thomas Reichler, Associate Professor - Department of Atmospheric Sciences
and
Junsu Kim
Department of Meteorology, University of Utah, Salt Lake City, Utah
Abstract
Information about climate and how it responds to increased greenhouse gas concentrations depends heavily on insight gained from numerical simulations by coupled climate models. The confidence placed in quantitative estimates of the rate and magnitude of future climate change is therefore strongly related to the quality of these models. In this study, we test the realism of several generations of coupled climate models, including those used for the 1995, 2001, and 2007 reports of the Intergovernmental Panel on Climate Change (IPCC). By validating against observations of present climate,.....
I clipped the statement and will put the rest of this statement in all fairness inside quote html tags after I finished and You can judge for Yourself to see if the rest was true ...
Most Americans have absolved at least high school
and do in fact know the difference between linear and non linear functions..
Some have not and don`t know,... except making retard remarks ,
we all know who they are, and their re(tard)marks will surely follow ....
All functions where Y is
directly or even just indirectly proportional to X are linear functions...no matter if Y= simply X, or Y= 2times X, or Y= Z*X/2, or Y= X * Z-whatever...each of these are linear no matter how complex You make the expression.
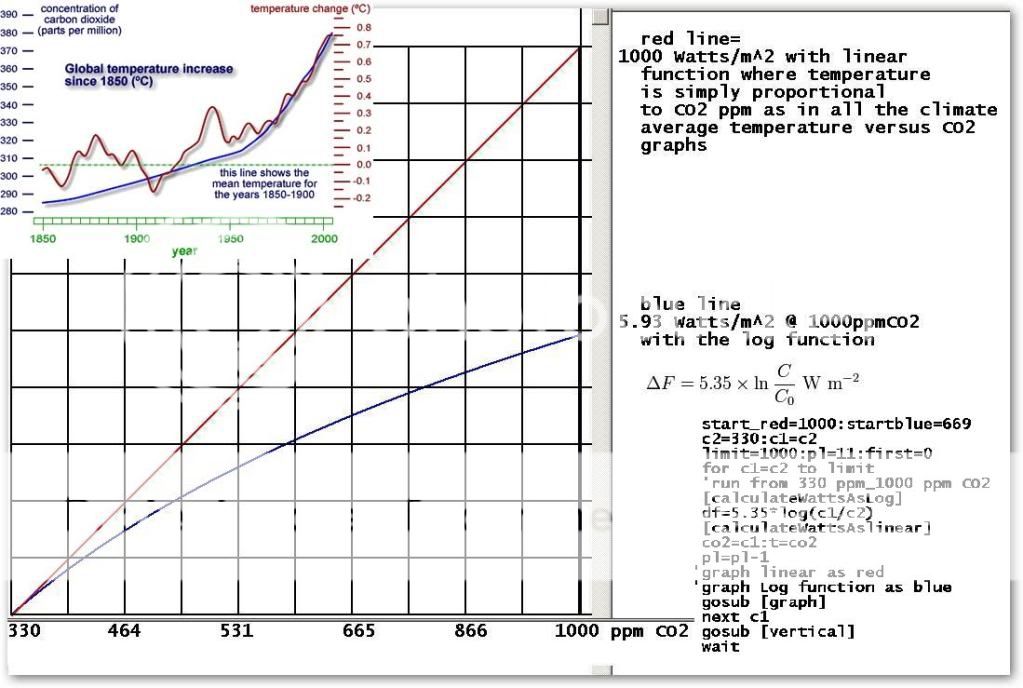
So if on any graph the "average global temperature" follows the Carbon di-Oxide concentration then the person who plotted this graph has stated that the temperature was in a
DIRECTLY LINEAR PROPORTION with the CO2 concentration...
there is no way out of this noose...so let`s pick up the loose end and pull it tight right now :
as You can see he plotted it, choosing the scale for each so that Temperature increase matches exactly CO2 ppm...in other words he just made the statement that Y=X...
This guy wanted to add a point on top of it all and chose a 2.5 times larger scale for his temperature to "show" how CO2 will cook this planet..:
But to conceal it he did not make it Y=X times 2.5...he also stayed with Y=X
And so far with no exception every "climate scientist" has been using this as empirical "proof" that it is CO2 driving the temperature and not anything else, because of this simple proportionality in any of these graphs they fabricate and as they also say...that if they plug in the radiative "forcing effect" of CO2 into their "climate computer model" they have a good match...and this is why I sat on the last part of the quote till I got to this point..:
In this study, we test the realism of several generations of coupled climate models, including those used for the 1995, 2001, and 2007 reports of the Intergovernmental Panel on Climate Change (IPCC). By validating against observations of present climate, we show that the coupled models have been steadily improving over time and that the best models are converging toward a level of accuracy that is similar to observation-based analyses of the atmosphere.
So now let`s tie up the loose end to something more solid and get on with the business at hand...
Radiative forcing - Wikipedia, the free encyclopedia
IPCC usage
The term “radiative forcing” has been used in the IPCC Assessments with a specific technical meaning, to denote an externally imposed perturbation in the radiative energy budget of Earth’s climate system, which may lead to changes in climate parameters.[1] The exact definition used is:
The radiative forcing of the surface-troposphere system due to the perturbation in or the introduction of an agent (say, a change in greenhouse gas concentrations) is the change in net (down minus up) irradiance (solar plus long-wave; in Wm-2) at the tropopause AFTER allowing for stratospheric temperatures to readjust to radiative equilibrium, but with surface and tropospheric temperatures and state held fixed at the unperturbed values.[2]
Then they revised it...:
In a subsequent report,[3] the IPCC defines it as:
"Radiative forcing is a measure of the influence a factor has in altering the balance of incoming and outgoing energy in the Earth-atmosphere system and is an index of the importance of the factor as a potential climate change mechanism. In this report radiative forcing values are for changes relative to preindustrial conditions defined at 1750 and are expressed in watts per square meter (W/m2)."
In simple terms, radiative forcing is "...the rate of energy change per unit area of the globe as measured at the top of the atmosphere."[4] In the context of climate change, the term "forcing" is restricted to changes in the radiation balance of the surface-troposphere system imposed by external factors, with no changes in stratospheric dynamics, no surface and tropospheric feedbacks in operation (i.e., no secondary effects induced because of changes in tropospheric motions or its thermodynamic state), and no dynamically induced changes in the amount and distribution of atmospheric water (vapour, liquid, and solid forms).
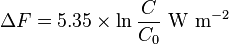
Radiative forcing can be used to estimate a subsequent change in equilibrium surface temperature (ΔTs) arising from that radiative forcing via the equation:
They should have never published this equation
All it takes is just a few minutes to write a short little program which shows that they DON NOT EVEN APPLY THEIR OWN OVERSIMPLIFIED EQUATION in any of these graphs where they wish to show that CO2 concentration and temperature are directly PROPORTIONAL, because this is no longer a LINEAR FUNCTION...
The reason why they don`t employ this equation when it comes to making these grossly falsified graphs showing a connection between CO2 & Temperature they CAN`T AFFORD TO USE THIS EQUATION, BECAUSE THE
calculated RADIATIVE FORCING EFFECT using their own equation dives way down from the "average temperatures" they claim to have measured..:
WindowHeight = 800
WindowWidth = 1000
UpperLeftX = 150
UpperLeftY = 25
open "graph" for graphics as #h
startred=1000:startblue=669:c2=330:c1=c2
limit=1000
for c1=c2 to limit
'display both functions from 330 to 1000 ppm CO2
[calculateWatts A sNatural Log (ln) function of CO2 concentration ratio]
' REMARK the synthax for ln is log, in any programming language the
'synthax log IS NOT the base 10 decade log
df=5.35*log(c1/c2)
[calculate Watts/m^2 Aslinear CO2 Function]
gosub [graph]
'graph linear as red ;graph Natural Log (ln)function as blue
next c1
gosub [vertical]
wait
[graph]
'mag=50
mag=53.5: x1=c1-279:x2=x1
y2=mag*df:y2=startblue-y2:y1=y2-1
print #h,"size 2"
print #h,"color blue"
print #h, "down"
print #h, "line ";x1;" ";y1;" ";x2;" ";y2
print #h, "flush "
print #h,"color red"
y2=startred-co2
y1=y2-1
print #h, "down"
print #h, "line ";x1;" ";y1;" ";x2;" ";y2
print #h, "flush "
return
[vertical]
x1=50:y1=startblue:y2=10:x2=x1
print #h,"color black"
print #h, "down"
print #h, "line ";x1;" ";y1;" ";x2;" ";y2
print #h, "flush "
x1=662:y1=startblue:y2=10:x2=x1
print #h,"color black"
print #h, "down"
print #h, "line ";x1;" ";y1;" ";x2;" ";y2
print #h, "flush "
'vertical calibration divisions
x1=50:x2=700:yscale=6.1
for z=0 to 100 step 10
y=startblue-(z*yscale)
y1=y:y2=y
print #h,"color black"
print #h, "down"
print #h, "line ";x1;" ";y1;" ";x2;" ";y2
print #h, "flush "
next z
'horizontal calibration divisions
xscale=6.1:y1=startblue:y2=startblue-611
b=50
for z1=0 to 100 step 10
d=b+(z1*xscale):x1=d:x2=d
print #h,"color black"
print #h, "down"
print #h, "line ";x1;" ";y1;" ";x2;" ";y2
print #h,"flush "
next z1
return
The blue line is what You would get if You did apply their equation, but for all the temperature graphs they had to straight-line it and simply made Temperature proportional to CO2 ppm as in Y=X
What does the "radiative forcing Watts per squ.- meter" have to do with temperature, You may ask,...
Well the mass of the earth`s atmosphere stays constant and if You increase the Watts which are 0.24 calories per second for each Watt then
that translates instantly to temperature increase per second by dividing the Watts by the specific heat or 1 Cubic meter air
Even the milk maid math Glow Ball graph fabricators realized that and pushed
aside for Y=X, where Y is the "average temperature" they claimed to have measured and X the ppm CO2 as per Mona Lua
But that`s not all they have simplified...take a look at the rest of their "Global Warming Math"...:
Radiative forcing - Wikipedia, the free encyclopedia
..... For the case of a change in solar irradiance, the radiative forcing is the change in the solar constant divided by 4 and multiplied by 0.7 to take into account the geometry of the sphere and the amount of reflected sunlight.
So solar radiation is a constant...and not a factor at all and simply by diminishing that "none factor" this huge nuclear reactor we call our sun further down to 70% which in their pea brains takes care of "the geometry of the earth...
So Yes of course they would have to keep insisting that solar activity has next to no effect on
THEIR "average global temperature" when compared to the "radiative forcing effect of man made greenhouse gasses".....
And that`s the operative here "THEIR" world...which has absolutely nothing to do with the real world
Like most here said all along, this is what we are dealing with here...:
;
To quote Westwall..:
Except that baseball is not really a German thing...
and anyone striking out playing games with us, The words "NEXT UP !!!" are to be understood quite literally .German is a very unambiguous language
and we do insist on the true meanings of words !!
And I `m an old fashioned German