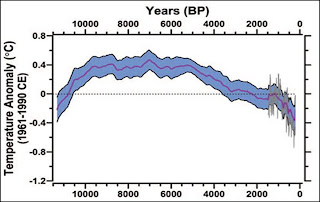
this is the part of Marcott's graph that he claimed was 'robust'. I wont bother going into the proxy dating issues that were ducked in Marcott's reply to critics.
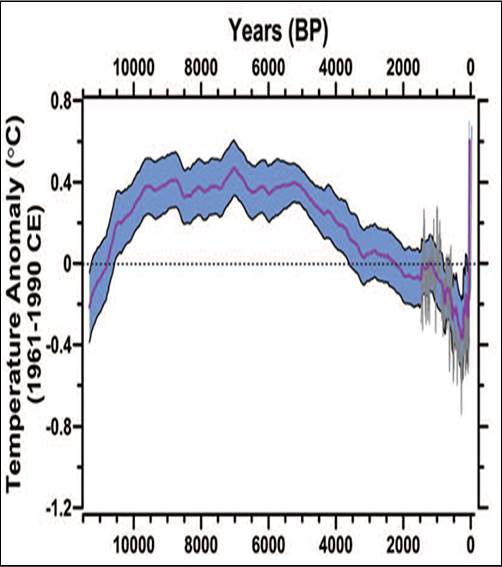
this is the full graph showing 'non-robust' data that was the focus of almost all of the media attention for a week, and in that time Marcott never thought to point out that the 20th century portion was 'for entertainment purposes only'.
(the following is from Pielke, jr link)
...However, here I document the gross misrepresentation of the findings of a recent scientific paper via press release which appears to skirt awfully close to crossing the line into research misconduct, as defined by the NRC....
The paper I refer to is by
Marcott et al. 2013, published recently in
Science. A
press release issued by the National Science Foundation, which funded the research, explains the core methodology and key conclusion of the paper as follows (emphasis added):
...What that history shows, the researchers say, is that during the last 5,000 years, the Earth on average cooled about 1.3 degrees Fahrenheit--until the last 100 years, when it warmed about 1.3 degrees F.The press release clearly explains that the paper (a) combines data from many sites around the world to create a "temperature reconstruction" which gives a "sense of the Earth's temperature history," and (b) "that history shows" a cooling over the past 5000 years, until the last 100 years when all of that cooling was reversed.
Examples of Media Coverage
Here is Justin Gillis at the New York Times, with emphasis added to this excerpt and also those further below:
The modern rise that has recreated the temperatures of 5,000 years ago is occurring at an exceedingly rapid clip on a geological time scale,
appearing in graphs in the new paper as a sharp vertical spike.
Any association with the so-called "hockey stick" is sure to capture interest in the highly politicized context of the climate debate, in which the iconic figure is like catnip to partisans on both sides. Here is
Michael Lemonick at Climate Central:
The study... confirms the now famous
“hockey stick” graph that
Michael Mann published more than a decade ago.
That study showed a sharp upward temperature trend over the past century after more than a thousand years of relatively flat temperatures. . .
There is a big problem with the media reporting of the new paper. It contains a fundamental error which (apparently) originates in the NSF press release and which was furthered by public comments by scientists.
In a belatedly-posted FAQ to the paper, which appeared on Real Climate earlier today,
Marcott et al. make this startling admission:
Q: What do paleotemperature reconstructions show about the temperature of the last 100 years?
A: Our global paleotemperature reconstruction includes a so-called “uptick” in temperatures during the 20th-century. However, in the paper we make the point that this particular feature is of shorter duration than the inherent smoothing in our statistical averaging procedure, and that it is based on only a few available paleo-reconstructions of the type we used.
Thus, the 20th century portion of our paleotemperature stack is not statistically robust, cannot be considered representative of global temperature changes, and therefore is not the basis of any of our conclusions.
(and ends with)
How to Fix This
Here are the steps that I recommend should be taken:
1)
Science should issue a correction to the paper, and specially do the following:
(a) retract and replot all figures in the paper and SI eliminating from the graphs all data/results that fail to meet the paper's criteria for "statistical robustness."
(b) include in the correction the explicit and unambiguous statement offered in the FAQ released today that the analysis is not "statistically robust" post-1900.
2) NSF should issue a correction to its press release, clarifying and correcting the statements of Peter Clark (a co-author, found above) and Candace Major, NSF program manager,
who says in the release:
"
The last century stands out as the anomaly in this record of global temperature since the end of the last ice age," says Candace Major, program director in the National Science Foundation's (NSF) Division of Ocean Sciences.3) The
New York Times (Gillis and Revkin, in particular),
Nature and
New Scientist as outlets that pride themselves in accurate reporting of science should update their stories with corrections. Grist and Climate Central should consider the same.
[UPDATE: Andy Revkin at DotEarth has updated his posts here and here to reference the "lost blade" from the hockey stick and link to this post. That was quick and easy. Others take note.]
Let me be perfectly clear -- I am accusing no one of scientific misconduct. The errors documented here could have been the product of group dynamics, institutional dysfunction, miscommunication, sloppiness or laziness (do note that misconduct can result absent explicit intent). However, what matters most now is how the relevant parties respond to the identification of a clear misrepresentation of a scientific paper by those who should not make such errors.
That response will say a lot about how this small but visible part of the climate community views the importance of scientific integrity.
IanC- obviously none of that was done. another typical example of how climate science is done.