Man made Global Warming Is Our Greatest Threat

Remember Al Gore and his movie...and his house that ate up 221,000 kwh of energy in 2006 alone? And the conferences to talk about climate change where everyone shows up in a jet instead of teleconferencing?

The rules don't apply to our betters, only to plebs like us.
 
That's right, if the President doesn't travel by either skateboard or horseback, it proves global warming isn't real.

What is it with all these conservatives demanding that everyone live in caves and hug trees and swear off deodorant and modern technology?
 
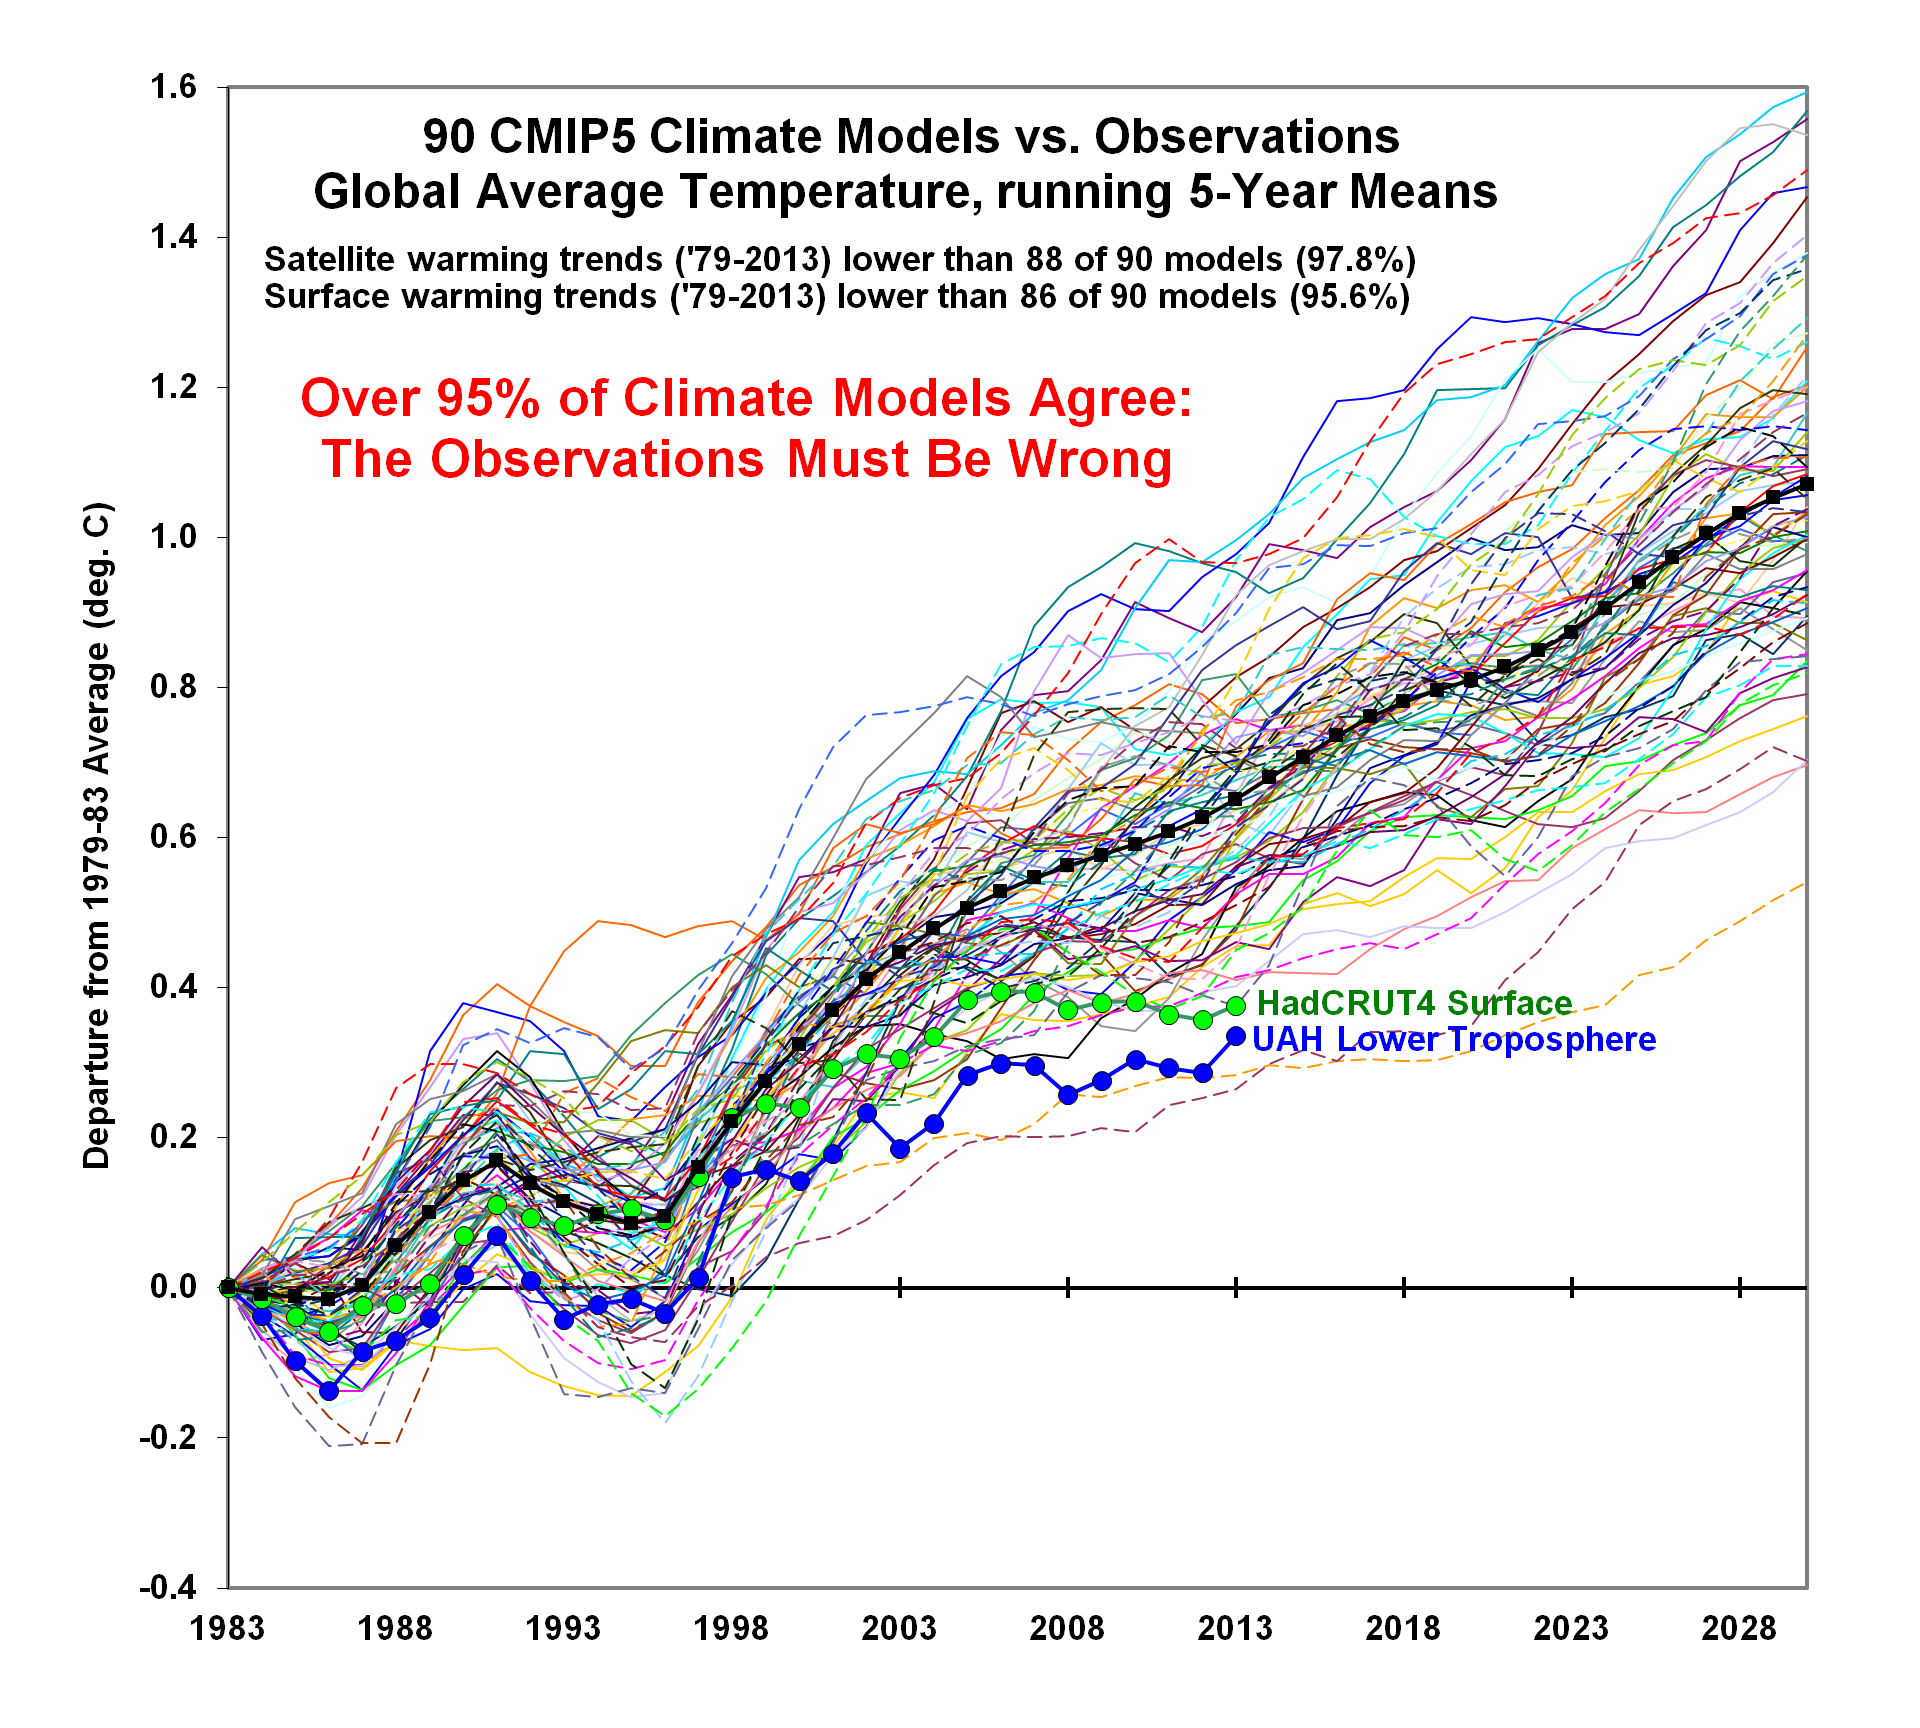
And as we all know that Man-made global warming is a farce..

But you can not tell it to the AGW cult:

CMIP5-90-models-global-Tsfc-vs-obs-thru-2013.png
 
That's right, if the President doesn't travel by either skateboard or horseback, it proves global warming isn't real.

What is it with all these conservatives demanding that everyone live in caves and hug trees and swear off deodorant and modern technology?

It is one of the most demented of the denier cult propaganda memes....

It tells them that they should reject and deny all of the well established scientific facts about human caused global warming because of their (usually quite mistaken and twisted) interpretations of the actions of some politician somewhere.

Example....scientists all over the world are reporting on the accelerating rise in sea levels that is going to flood cities and inundate whole islands (creating enormous numbers of climate change refugees) and contaminate agricultural aquifers with salt water, etc.,...and the denier cult dingbats dismiss all of that by incorrectly believing (as their propaganda pushing puppet-masters have told them) that former Vice President Gore bought an "ocean front house", so therefore "he isn't worried about sea level rise". Of course, in reality, Gore bought an "ocean-view" house for his soon-to-be-ex-wife, which is located in the foothills above Montecito CA, at over 500 feet in elevation above sea level. But that bogus "ocean-front house" lie is the level of "evidence" that these idiots will accept as a reason to reject science and stooge for the Koch brothers.
 
And as we all know that Man-made global warming is a farce..

But you can not tell it to the AGW cult:

Kosh, endlessly reposting your faked graph doesn't make it any less fraudulent.

Yes, we know you believe in it with a sort of fanatical religious fervor. You're a very devoted and very brainwashed cultist, so you believe what you're told to believe, and your morally pure mind is never sullied with impure independent thoughts that might contradict the sacred teachings of the cult.

Just understand that all the scientists and rational people know with 100% certainty that you're pushing fraudulent propaganda on behalf of your cult. That's why the world is ignoring you. There's no conspiracy. The world just recognizes you to be a cult dupe. Don't get your hopes up that anyone is falling for your cult's faked data scam, because they're not.

 
That's right, if the President doesn't travel by either skateboard or horseback, it proves global warming isn't real.

What is it with all these conservatives demanding that everyone live in caves and hug trees and swear off deodorant and modern technology?

Its called leadership, when you start to do it I will.

Ya know I turned my phone off for a about a month between Febuary 19th and March 15 th?


No phone, no internet ...

You should try to break my record :)
 
And as we all know that Man-made global warming is a farce..

But you can not tell it to the AGW cult:

Kosh, endlessly reposting your faked graph doesn't make it any less fraudulent.

Yes, we know you believe in it with a sort of fanatical religious fervor. You're a very devoted and very brainwashed cultist, so you believe what you're told to believe, and your morally pure mind is never sullied with impure independent thoughts that might contradict the sacred teachings of the cult.

Just understand that all the scientists and rational people know with 100% certainty that you're pushing fraudulent propaganda on behalf of your cult. That's why the world is ignoring you. There's no conspiracy. The world just recognizes you to be a cult dupe. Don't get your hopes up that anyone is falling for your cult's faked data scam, because they're not.


Lmao what propaganda??????

Who is telling us this? History books? Science books? The oil companies who spent millions to develope green energy?

We al know who is telling you your talking points.

The likes of Naomi Klien....
 
Speaking of the lack of brains and critical thinking skills...

certaintychannel_ipcc_reality.png


As the lie of AGW becomes more evident, they lie bigger about their confidence in that lie, in the hopes that no one will look closely.. Empirical evidence shows them frauds liars and deceitful pukes, but the faithful will believe the lies without question..
 
Speaking of the lack of brains and critical thinking skills...
....and you pop right up.....moronically serving as one of the best example of brainless stupidity on this forum.....and there is a LOT of competition for that position from your fellow denier cult retards....


toiletpaper://wattsupwiththat.files.wordpress.com/2014/03/certaintychannel_ipcc_reality.png?w=72
Like all of the other denier cult wackos, you inevitably try to cite worthless anti-science propaganda from a fossil fuel industry sponsored blog, while ignoring the actual science from reputable scientists published in the peer-reviewed science journals.

As far as your bogus graph goes....

...[Graph] comparing the global surface temperature projections from each of the first four IPCC reports to the subsequent observed temperature changes. We show that not only have the IPCC surface temperature projections been remarkably accurate, but they have also performed much better than predictions made by climate contrarians (Figure 1).


Figure 1: IPCC temperature projections (red, pink, orange, green) and contrarian projections (blue and purple) vs. observed surface temperature changes (average of NASAGISS, NOAA NCDC, and HadCRUT4; black and red) for 1990 through 2012.


Figure 3: IPCC FAR BAU global surface temperature projection adjusted to reflect observed GHG radiative forcings 1990-2011 (blue) vs. observed surface temperature changes (average of NASA GISS, NOAA NCDC, and HadCRUT4; red) for 1990 through 2012.


Figure 5: IPCC SAR Scenario IS92a global surface temperature projection (blue) vs. observed surface temperature changes (average of NASA GISS, NOAA NCDC, and HadCRUT4; red) for 1990 through 2012.


Figure 7: IPCC TAR model projection for emissions Scenario A2 (blue) vs. observed surface temperature changes (average of NASA GISS, NOAA NCDC, and HadCRUT4; red) for 1990 through 2012.

Rahmstorf et al. (2012) Verify TAR and AR4 Accuracy

A paper published in Environmental Research Letters by Rahmstorf, Foster, and Cazenave (2012) applied the methodology of Foster and Rahmstorf (2011), using the statistical technique of multiple regression to filter out the influences of the El Niño Southern Oscillation (ENSO) and solar and volcanic activity from the global surface temperature data to evaluate the underlying long-term primarily human-caused trend. Figure 11 compares their results with and without the short-term noise from natural temperature influences (pink and red, respectively) to the IPCC TAR (blue) and AR4 (green) projections.


Figure 11: Observed annual global temperature, unadjusted (pink) and adjusted for short-term variations due to solar variability, volcanoes, and ENSO (red) as in Foster and Rahmstorf (2011). 12-month running averages are shown as well as linear trend lines, and compared to the scenarios of the IPCC (blue range and lines from the 2001 report, green from the 2007 report). Projections are aligned in the graph so that they start (in 1990 and 2000, respectively) on the linear trend line of the (adjusted) observational data.

Frame and Stone (2012) Verify FAR Accuracy

A paper published in Nature Climate Change, Frame and Stone (2012), sought to evaluate the FAR temperature projection accuracy by using a simple climate model to simulate the warming from 1990 through 2010 based on observed GHG and other global heat imbalance changes. Figure 12 shows their results. Since the FAR only projected temperature changes as a result of GHG changes, the light blue line (model-simuated warming in response to GHGs only) is the most applicable result.


Figure 12: Observed changes in global mean surface temperature over the 1990–2010 period from HadCRUT3 and GISTEMP (red) vs. FAR BAU best estimate (dark blue), vs. projections using a one-dimensional energy balance model (EBM) with the measured GHGradiative forcing since 1990 (light blue) and with the overall radiative forcing since 1990 (green). Natural variability from the ensemble of 587 21-year-long segments of control simulations (with constant external forcings) from 24 Coupled Model Intercomparison Project phase 3 (CMIP3) climate models is shown in black and gray. From Frame and Stone (2012).

(excerpts from: Contrary to Contrarian Claims, IPCC Temperature Projections Have Been Exceptionally Accurate)


As the lie of AGW becomes more evident, they lie bigger about their confidence in that lie, in the hopes that no one will look closely.. Empirical evidence shows them frauds liars and deceitful pukes, but the faithful will believe the lies without question..

More of the usual anti-science denier cult crackpot conspiracy theory insanity about the entire world scientific community plotting to fool the rightwingnuts. Laughable and very pathetic!
 
More of the usual anti-science denier cult crackpot conspiracy theory insanity about the entire world scientific community plotting to fool the rightwingnuts. Laughable and very pathetic!
And we all see your damn dare science, the solution, "lets build some big windmills, and lets build a lot, and lets ignore all the pollution we create using heavy industry in third world countries, cuz we gots to build them big and fast, and lot of em."

Yep, creative forward thinking, we can simply use fossil fuels and hydrocarbons to turn the world into a giant wind farm, dont care about the land or nothing, we just got to put up millions of wind mills.

That there is science.
Nope! There is your utter insanity, Ejakulatra, laid bare for all to see!
 
Right, because Winston Churchill telling the British during WW2 that they had to conserve fuel for the military, and then getting in a car to go to his house, was just absolutely unforgivable! How can you say one thing and then do the other? Churchill should have walked everywhere if he was serious!

Could it be because the argument linking the two is a fallacy? Hmm, yes.

"You can always count on Americans to do the right thing - only after they've tried everything else." - Winston Churchill -


The denier cult's days are numbered. Reality cannot be ignored.
 
That's right, if the President doesn't travel by either skateboard or horseback, it proves global warming isn't real.

What is it with all these conservatives demanding that everyone live in caves and hug trees and swear off deodorant and modern technology?

Its called leadership, when you start to do it I will.

Ya know I turned my phone off for a about a month between Febuary 19th and March 15 th?


No phone, no internet ...

You should try to break my record :)
Now why should I want to go back to what I experianced as a child. No phone, no internet. And a very small library in the nearest town for reading material. No thank you. I love the fact that the knowledge of the world is at my fingertips.
 
Speaking of the lack of brains and critical thinking skills...
....and you pop right up.....moronically serving as one of the best example of brainless stupidity on this forum.....and there is a LOT of competition for that position from your fellow denier cult retards....


toiletpaper://wattsupwiththat.files.wordpress.com/2014/03/certaintychannel_ipcc_reality.png?w=72
Like all of the other denier cult wackos, you inevitably try to cite worthless anti-science propaganda from a fossil fuel industry sponsored blog, while ignoring the actual science from reputable scientists published in the peer-reviewed science journals.

As far as your bogus graph goes....

...[Graph] comparing the global surface temperature projections from each of the first four IPCC reports to the subsequent observed temperature changes. We show that not only have the IPCC surface temperature projections been remarkably accurate, but they have also performed much better than predictions made by climate contrarians (Figure 1).


Figure 1: IPCC temperature projections (red, pink, orange, green) and contrarian projections (blue and purple) vs. observed surface temperature changes (average of NASAGISS, NOAA NCDC, and HadCRUT4; black and red) for 1990 through 2012.


Figure 3: IPCC FAR BAU global surface temperature projection adjusted to reflect observed GHG radiative forcings 1990-2011 (blue) vs. observed surface temperature changes (average of NASA GISS, NOAA NCDC, and HadCRUT4; red) for 1990 through 2012.


Figure 5: IPCC SAR Scenario IS92a global surface temperature projection (blue) vs. observed surface temperature changes (average of NASA GISS, NOAA NCDC, and HadCRUT4; red) for 1990 through 2012.


Figure 7: IPCC TAR model projection for emissions Scenario A2 (blue) vs. observed surface temperature changes (average of NASA GISS, NOAA NCDC, and HadCRUT4; red) for 1990 through 2012.

Rahmstorf et al. (2012) Verify TAR and AR4 Accuracy

A paper published in Environmental Research Letters by Rahmstorf, Foster, and Cazenave (2012) applied the methodology of Foster and Rahmstorf (2011), using the statistical technique of multiple regression to filter out the influences of the El Niño Southern Oscillation (ENSO) and solar and volcanic activity from the global surface temperature data to evaluate the underlying long-term primarily human-caused trend. Figure 11 compares their results with and without the short-term noise from natural temperature influences (pink and red, respectively) to the IPCC TAR (blue) and AR4 (green) projections.


Figure 11: Observed annual global temperature, unadjusted (pink) and adjusted for short-term variations due to solar variability, volcanoes, and ENSO (red) as in Foster and Rahmstorf (2011). 12-month running averages are shown as well as linear trend lines, and compared to the scenarios of the IPCC (blue range and lines from the 2001 report, green from the 2007 report). Projections are aligned in the graph so that they start (in 1990 and 2000, respectively) on the linear trend line of the (adjusted) observational data.

Frame and Stone (2012) Verify FAR Accuracy

A paper published in Nature Climate Change, Frame and Stone (2012), sought to evaluate the FAR temperature projection accuracy by using a simple climate model to simulate the warming from 1990 through 2010 based on observed GHG and other global heat imbalance changes. Figure 12 shows their results. Since the FAR only projected temperature changes as a result of GHG changes, the light blue line (model-simuated warming in response to GHGs only) is the most applicable result.


Figure 12: Observed changes in global mean surface temperature over the 1990–2010 period from HadCRUT3 and GISTEMP (red) vs. FAR BAU best estimate (dark blue), vs. projections using a one-dimensional energy balance model (EBM) with the measured GHGradiative forcing since 1990 (light blue) and with the overall radiative forcing since 1990 (green). Natural variability from the ensemble of 587 21-year-long segments of control simulations (with constant external forcings) from 24 Coupled Model Intercomparison Project phase 3 (CMIP3) climate models is shown in black and gray. From Frame and Stone (2012).

(excerpts from: Contrary to Contrarian Claims, IPCC Temperature Projections Have Been Exceptionally Accurate)


As the lie of AGW becomes more evident, they lie bigger about their confidence in that lie, in the hopes that no one will look closely.. Empirical evidence shows them frauds liars and deceitful pukes, but the faithful will believe the lies without question..

More of the usual anti-science denier cult crackpot conspiracy theory insanity about the entire world scientific community plotting to fool the rightwingnuts. Laughable and very pathetic!
Look at the 2001 IPCC graph. Extend it to 2015. Then put the dot above 0.8, which is off the graph. Looks like the 'Pause' isn't.
 
Speaking of the lack of brains and critical thinking skills...
....and you pop right up.....moronically serving as one of the best example of brainless stupidity on this forum.....and there is a LOT of competition for that position from your fellow denier cult retards....


toiletpaper://wattsupwiththat.files.wordpress.com/2014/03/certaintychannel_ipcc_reality.png?w=72
Like all of the other denier cult wackos, you inevitably try to cite worthless anti-science propaganda from a fossil fuel industry sponsored blog, while ignoring the actual science from reputable scientists published in the peer-reviewed science journals.

As far as your bogus graph goes....

...[Graph] comparing the global surface temperature projections from each of the first four IPCC reports to the subsequent observed temperature changes. We show that not only have the IPCC surface temperature projections been remarkably accurate, but they have also performed much better than predictions made by climate contrarians (Figure 1).


Figure 1: IPCC temperature projections (red, pink, orange, green) and contrarian projections (blue and purple) vs. observed surface temperature changes (average of NASAGISS, NOAA NCDC, and HadCRUT4; black and red) for 1990 through 2012.


Figure 3: IPCC FAR BAU global surface temperature projection adjusted to reflect observed GHG radiative forcings 1990-2011 (blue) vs. observed surface temperature changes (average of NASA GISS, NOAA NCDC, and HadCRUT4; red) for 1990 through 2012.


Figure 5: IPCC SAR Scenario IS92a global surface temperature projection (blue) vs. observed surface temperature changes (average of NASA GISS, NOAA NCDC, and HadCRUT4; red) for 1990 through 2012.


Figure 7: IPCC TAR model projection for emissions Scenario A2 (blue) vs. observed surface temperature changes (average of NASA GISS, NOAA NCDC, and HadCRUT4; red) for 1990 through 2012.

Rahmstorf et al. (2012) Verify TAR and AR4 Accuracy

A paper published in Environmental Research Letters by Rahmstorf, Foster, and Cazenave (2012) applied the methodology of Foster and Rahmstorf (2011), using the statistical technique of multiple regression to filter out the influences of the El Niño Southern Oscillation (ENSO) and solar and volcanic activity from the global surface temperature data to evaluate the underlying long-term primarily human-caused trend. Figure 11 compares their results with and without the short-term noise from natural temperature influences (pink and red, respectively) to the IPCC TAR (blue) and AR4 (green) projections.


Figure 11: Observed annual global temperature, unadjusted (pink) and adjusted for short-term variations due to solar variability, volcanoes, and ENSO (red) as in Foster and Rahmstorf (2011). 12-month running averages are shown as well as linear trend lines, and compared to the scenarios of the IPCC (blue range and lines from the 2001 report, green from the 2007 report). Projections are aligned in the graph so that they start (in 1990 and 2000, respectively) on the linear trend line of the (adjusted) observational data.

Frame and Stone (2012) Verify FAR Accuracy

A paper published in Nature Climate Change, Frame and Stone (2012), sought to evaluate the FAR temperature projection accuracy by using a simple climate model to simulate the warming from 1990 through 2010 based on observed GHG and other global heat imbalance changes. Figure 12 shows their results. Since the FAR only projected temperature changes as a result of GHG changes, the light blue line (model-simuated warming in response to GHGs only) is the most applicable result.


Figure 12: Observed changes in global mean surface temperature over the 1990–2010 period from HadCRUT3 and GISTEMP (red) vs. FAR BAU best estimate (dark blue), vs. projections using a one-dimensional energy balance model (EBM) with the measured GHGradiative forcing since 1990 (light blue) and with the overall radiative forcing since 1990 (green). Natural variability from the ensemble of 587 21-year-long segments of control simulations (with constant external forcings) from 24 Coupled Model Intercomparison Project phase 3 (CMIP3) climate models is shown in black and gray. From Frame and Stone (2012).

(excerpts from: Contrary to Contrarian Claims, IPCC Temperature Projections Have Been Exceptionally Accurate)


As the lie of AGW becomes more evident, they lie bigger about their confidence in that lie, in the hopes that no one will look closely.. Empirical evidence shows them frauds liars and deceitful pukes, but the faithful will believe the lies without question..

More of the usual anti-science denier cult crackpot conspiracy theory insanity about the entire world scientific community plotting to fool the rightwingnuts. Laughable and very pathetic!
and again, projection is not fact and no facts means you have squat. So simply put, you are a hypocrite since you obscenely post up nonsense that has nothing to do with factual information. post up temperature graphs, not anomaly made up graphs. hahahhahhahhaha you can't, cause that would further expose your ignorance.
 
We put up facts all the time and you claim we don't. That makes you a liar.

You've got some choices. You could be:

1) Wrong and feel a little stupid
2) Right but slightly embarrassed
3) Wrong and lying and feel a little stupid and lotta scumbag human being for having the ethics of a spitoon.
 

Forum List

Back
Top