Source:
https://www.esrl.noaa.gov/gmd/publications/annual_meetings/2017/slides/7-Keen.pdf
Overlaying this graph with all these exaggerated graphs for temperature "anomalies" pops the CO2 hot-air balloon.
Have as much of a nice day as is possible during this "warm" winter
https://www.esrl.noaa.gov/gmd/publications/annual_meetings/2017/slides/7-Keen.pdf
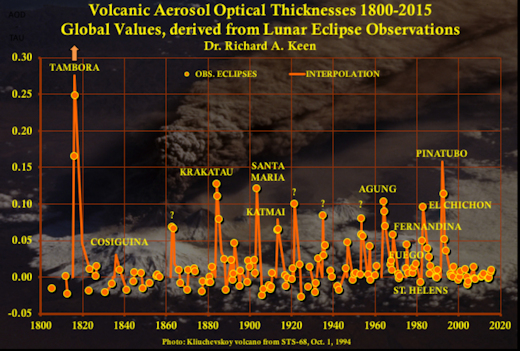
There was more volcanic effect on the
climate during 1913-1962, and less from
1816-1882, than previously estimated.
Cosegüina in 1835 was a dud.
Since 1979, Volcanic forcing is responsible
for half of the observed warming (global
MSU Satellite temperatures).
There has been no increase of volcanic
forcing since 1996, ruling out volcanoes
out as a Cause of the Pause..
Overlaying this graph with all these exaggerated graphs for temperature "anomalies" pops the CO2 hot-air balloon.
Have as much of a nice day as is possible during this "warm" winter
