July 2019 Was Not the Warmest on Record

And the Polar jet has decimated all hurricane formation..8/15/2019 and still not one named storm... National Hurricane Center
WRONG! There have been two named storms, Andrea and Barry 2019 Atlantic hurricane season - Wikipedia
Not according to NOAA..Wikipedia incorrectly names two tropical depressions that never made hurricane status... Now that's damn funny....
You just moved the goal posts. Suddenly "named storms" isn't good enough; now it's "hurricane".
Naming tropical depressions is a fine example of moving goalposts...and naming winter storms...when did tropical depressions and winter storms start getting names?
You seem to have gotten some misinformation here. The first named storm, Andrea, was a tropical storm and the second, Barry, was a hurricane. Tropical depressions don't get named.

Andrea was NEVER a Tropical Storm as its sustained winds peaked at 40 mph.

Barry was a WEAK Hurricane from July 11-15, never was above the minimum 75 mph, and that was for a few hours on July 13.

The season is now well below average for Tropical Storms, with NO tropical storms expected for the next 5 days:

two_atl_5d0.png


LINK
 
WRONG! There have been two named storms, Andrea and Barry 2019 Atlantic hurricane season - Wikipedia
Not according to NOAA..Wikipedia incorrectly names two tropical depressions that never made hurricane status... Now that's damn funny....
You just moved the goal posts. Suddenly "named storms" isn't good enough; now it's "hurricane".
Naming tropical depressions is a fine example of moving goalposts...and naming winter storms...when did tropical depressions and winter storms start getting names?
You seem to have gotten some misinformation here. The first named storm, Andrea, was a tropical storm and the second, Barry, was a hurricane. Tropical depressions don't get named.
Andrea was NEVER a Tropical Storm as its sustained winds peaked at 40 mph.
Tropical storms START at 35 mph, so..., you lose again.

Tropical cyclone - Wikipedia

Now you are just embarrassing yourself since it was categorized as a SUBTROPICAL storm, it was never officially called a Tropical storm for a reason that eludes you.

On May 17, 2019, the National Hurricane Center (NHC) began forecasting the formation of an area of low pressure south of Bermuda, which had the potential to later develop into a tropical or subtropical cyclone.[18] On the following day, a large and elongated area of clouds and thunderstorms developed well to the east of the Bahamas.[19] The disturbance gradually organized over the next two days as it moved westward and then northward, though it still lacked a well-defined circulation. However, an Air Force reconnaissance flight late on May 20 revealed that the storm had a well-defined center with winds reaching gale force, due to being involved with an upper-level low to its west, leading to the classification of the system as Subtropical Storm Andrea at 22:30 UTC that day.[20] Soon afterward, Andrea reached its peak intensity.[21] The nascent storm did not last very long, as the storm encountered dry air from the south, as well as southerly wind shear. These hostile conditions caused Andrea's convection to dissipate, and the storm degenerated into a remnant low early on the next day.

bolding mine

LINK

There is a specific difference between a SUBTROPICAL storm and a Tropical storm, as shown here, from the Weather Channel:

What's the Difference Between Subtropical and Tropical Storms?

Excerpt:

"When an area of low pressure forms over waters with sea-surface temperatures of at least 70 degrees, a subtropical low can form. This is due to the core of the storm becoming warm, deriving some of its energy from latent heat, or energy released when water vapor that evaporated from the warm water is condensed into liquid.


A subtropical storm exhibits features of both tropical and non-tropical systems. This includes no cold or warm fronts, a broad wind field and thunderstorms removed some distance from the center of circulation.

Mature subtropical systems also often have a large, cloud-free center and a less symmetric wind field. Maximum sustained winds are also much farther from the center, while the strongest winds in a tropical storm are close to the center.

Subtropical cyclones typically are associated with upper-level lows and have colder temperatures aloft, whereas tropical cyclones are completely warm-core and upper-level high-pressure systems overhead help facilitate their intensification."

bolding mine

There are plenty of NON tropical storms that can also produce 40+ mph sustained winds, ever heard of a cold front based thunder storm?

You should stop digging now.
 
And the Polar jet has decimated all hurricane formation..8/15/2019 and still not one named storm... National Hurricane Center
WRONG! There have been two named storms, Andrea and Barry 2019 Atlantic hurricane season - Wikipedia
Not according to NOAA..Wikipedia incorrectly names two tropical depressions that never made hurricane status... Now that's damn funny....
You just moved the goal posts. Suddenly "named storms" isn't good enough; now it's "hurricane".
You are a moron.... Naming storms under category 1 is just 10 years old. IT was the alarmist who changed the matrix so they could hype the number of storms. Its been a ruse for a long time.
 
You just moved the goal posts. Suddenly "named storms" isn't good enough; now it's "hurricane".
Naming tropical depressions is a fine example of moving goalposts...and naming winter storms...when did tropical depressions and winter storms start getting names?
You seem to have gotten some misinformation here. The first named storm, Andrea, was a tropical storm and the second, Barry, was a hurricane. Tropical depressions don't get named.
Andrea was NEVER a Tropical Storm as its sustained winds peaked at 40 mph.
Tropical storms START at 35 mph, so..., you lose again.

Tropical cyclone - Wikipedia

Now you are just embarrassing yourself since it was categorized as a SUBTROPICAL storm, it was never officially called a Tropical storm for a reason that eludes you.

On May 17, 2019, the National Hurricane Center (NHC) began forecasting the formation of an area of low pressure south of Bermuda, which had the potential to later develop into a tropical or subtropical cyclone.[18] On the following day, a large and elongated area of clouds and thunderstorms developed well to the east of the Bahamas.[19] The disturbance gradually organized over the next two days as it moved westward and then northward, though it still lacked a well-defined circulation. However, an Air Force reconnaissance flight late on May 20 revealed that the storm had a well-defined center with winds reaching gale force, due to being involved with an upper-level low to its west, leading to the classification of the system as Subtropical Storm Andrea at 22:30 UTC that day.[20] Soon afterward, Andrea reached its peak intensity.[21] The nascent storm did not last very long, as the storm encountered dry air from the south, as well as southerly wind shear. These hostile conditions caused Andrea's convection to dissipate, and the storm degenerated into a remnant low early on the next day.

bolding mine

LINK

There is a specific difference between a SUBTROPICAL storm and a Tropical storm, as shown here, from the Weather Channel:

What's the Difference Between Subtropical and Tropical Storms?

Excerpt:

"When an area of low pressure forms over waters with sea-surface temperatures of at least 70 degrees, a subtropical low can form. This is due to the core of the storm becoming warm, deriving some of its energy from latent heat, or energy released when water vapor that evaporated from the warm water is condensed into liquid.


A subtropical storm exhibits features of both tropical and non-tropical systems. This includes no cold or warm fronts, a broad wind field and thunderstorms removed some distance from the center of circulation.

Mature subtropical systems also often have a large, cloud-free center and a less symmetric wind field. Maximum sustained winds are also much farther from the center, while the strongest winds in a tropical storm are close to the center.

Subtropical cyclones typically are associated with upper-level lows and have colder temperatures aloft, whereas tropical cyclones are completely warm-core and upper-level high-pressure systems overhead help facilitate their intensification."

bolding mine

There are plenty of NON tropical storms that can also produce 40+ mph sustained winds, ever heard of a cold front based thunder storm?

You should stop digging now.
Then why did it get named? Tropical? subtropical? It had sustained winds over 35 mph, so it got named. That was the original claim, that there have been no named storms and we haven't even discussed Barry, which WAS a hurricane.
 
And the Polar jet has decimated all hurricane formation..8/15/2019 and still not one named storm... National Hurricane Center
WRONG! There have been two named storms, Andrea and Barry 2019 Atlantic hurricane season - Wikipedia
Not according to NOAA..Wikipedia incorrectly names two tropical depressions that never made hurricane status... Now that's damn funny....
You just moved the goal posts. Suddenly "named storms" isn't good enough; now it's "hurricane".
You are a moron.... Naming storms under category 1 is just 10 years old. IT was the alarmist who changed the matrix so they could hype the number of storms. Its been a ruse for a long time.
What does the length of time they've been naming storms have to do with it? The storm WAS named and the poster that said there haven't been any is the real moron. How about Barry? It definitely WAS a hurricane.
Prior to 2010 the naming of storms only occurred when they reached 75mph and category 1 status. Today they are naming tropical depressions. This improperly inflates the numbers of storms. If we look only at the data of all these, the numbers drop rapidly to normal creation numbers seen over the last 150 years.
 
Naming tropical depressions is a fine example of moving goalposts...and naming winter storms...when did tropical depressions and winter storms start getting names?
You seem to have gotten some misinformation here. The first named storm, Andrea, was a tropical storm and the second, Barry, was a hurricane. Tropical depressions don't get named.
Andrea was NEVER a Tropical Storm as its sustained winds peaked at 40 mph.
Tropical storms START at 35 mph, so..., you lose again.

Tropical cyclone - Wikipedia

Now you are just embarrassing yourself since it was categorized as a SUBTROPICAL storm, it was never officially called a Tropical storm for a reason that eludes you.

On May 17, 2019, the National Hurricane Center (NHC) began forecasting the formation of an area of low pressure south of Bermuda, which had the potential to later develop into a tropical or subtropical cyclone.[18] On the following day, a large and elongated area of clouds and thunderstorms developed well to the east of the Bahamas.[19] The disturbance gradually organized over the next two days as it moved westward and then northward, though it still lacked a well-defined circulation. However, an Air Force reconnaissance flight late on May 20 revealed that the storm had a well-defined center with winds reaching gale force, due to being involved with an upper-level low to its west, leading to the classification of the system as Subtropical Storm Andrea at 22:30 UTC that day.[20] Soon afterward, Andrea reached its peak intensity.[21] The nascent storm did not last very long, as the storm encountered dry air from the south, as well as southerly wind shear. These hostile conditions caused Andrea's convection to dissipate, and the storm degenerated into a remnant low early on the next day.

bolding mine

LINK

There is a specific difference between a SUBTROPICAL storm and a Tropical storm, as shown here, from the Weather Channel:

What's the Difference Between Subtropical and Tropical Storms?

Excerpt:

"When an area of low pressure forms over waters with sea-surface temperatures of at least 70 degrees, a subtropical low can form. This is due to the core of the storm becoming warm, deriving some of its energy from latent heat, or energy released when water vapor that evaporated from the warm water is condensed into liquid.


A subtropical storm exhibits features of both tropical and non-tropical systems. This includes no cold or warm fronts, a broad wind field and thunderstorms removed some distance from the center of circulation.

Mature subtropical systems also often have a large, cloud-free center and a less symmetric wind field. Maximum sustained winds are also much farther from the center, while the strongest winds in a tropical storm are close to the center.

Subtropical cyclones typically are associated with upper-level lows and have colder temperatures aloft, whereas tropical cyclones are completely warm-core and upper-level high-pressure systems overhead help facilitate their intensification."

bolding mine

There are plenty of NON tropical storms that can also produce 40+ mph sustained winds, ever heard of a cold front based thunder storm?

You should stop digging now.
Then why did it get named? Tropical? subtropical? It had sustained winds over 35 mph, so it got named. That was the original claim, that there have been no named storms and we haven't even discussed Barry, which WAS a hurricane.

I never disputed the two storms existence, Hurricane Barry did happen as I POINTED out earlier, you forgot already? From post 21, I wrote:

"Andrea was NEVER a Tropical Storm as its sustained winds peaked at 40 mph.

Barry was a WEAK Hurricane from July 11-15, never was above the minimum 75 mph, and that was for a few hours on July 13.

The season is now well below average for Tropical Storms, with NO tropical storms expected for the next 5 days:"

=====

From the start I correctly stated that Andrea was NOT a Tropical storm, which you disputed on the basis of wind speed, but you failed to realize that it was officially named as a SUBTROPICAL storm even with 40 mph sustained winds because of its different development status, as I already pointed out to you:

Subtropical cyclones typically are associated with upper-level lows and have colder temperatures aloft, whereas tropical cyclones are completely warm-core and upper-level high-pressure systems overhead help facilitate their intensification."

They increased their classification table to allow more different types of storms to be named, Subtropical Storm classification is one of them to distinguish the difference between a minimum Tropical Storm and a Subtropical Storm.

Too many people like you, fell for the misleading claims of more Tropical Storms, when actually there is no increase at all, just the names of storms increased, not the total number of storms.
 
WRONG! There have been two named storms, Andrea and Barry 2019 Atlantic hurricane season - Wikipedia
Not according to NOAA..Wikipedia incorrectly names two tropical depressions that never made hurricane status... Now that's damn funny....
You just moved the goal posts. Suddenly "named storms" isn't good enough; now it's "hurricane".
You are a moron.... Naming storms under category 1 is just 10 years old. IT was the alarmist who changed the matrix so they could hype the number of storms. Its been a ruse for a long time.
What does the length of time they've been naming storms have to do with it? The storm WAS named and the poster that said there haven't been any is the real moron. How about Barry? It definitely WAS a hurricane.
Prior to 2010 the naming of storms only occurred when they reached 75mph and category 1 status. Today they are naming tropical depressions. This improperly inflates the numbers of storms. If we look only at the data of all these, the numbers drop rapidly to normal creation numbers seen over the last 150 years.
Barry WAS a hurricane, so all this other stuff is just a smokescreen to cover up the fact that the claim was there were no named storms. Your info, while interesting, is irrelevant to the discussion. Over and out.
 
From Global Warming

July 2019 Was Not the Warmest on Record

August 2nd, 2019 by Roy W. Spencer, Ph. D.

EXCERPT:

July 2019 was probably the 4th warmest of the last 41 years. Global “reanalysis” datasets need to start being used for monitoring of global surface temperatures. [NOTE: It turns out that the WMO, which announced July 2019 as a near-record, relies upon the ERA5 reanalysis which apparently departs substantially from the CFSv2 reanalysis, making my proposed reliance on only reanalysis data for surface temperature monitoring also subject to considerable uncertainty].

and

"(1) The urban heat island (UHI) effect has caused a gradual warming of most land thermometer sites due to encroachment of buildings, parking lots, air conditioning units, vehicles, etc. These effects are localized, not indicative of most of the global land surface (which remains most rural), and not caused by increasing carbon dioxide in the atmosphere. Because UHI warming “looks like” global warming, it is difficult to remove from the data. In fact, NOAA’s efforts to make UHI-contaminated data look like rural data seems to have had the opposite effect. The best strategy would be to simply use only the best (most rural) sited thermometers. This is currently not done."

LINK

===

Here is his other blog post showing the UAH temperature data, that has a .09C COOLING from June:

UAH Global Temperature Update for July, 2019: +0.38 deg. C
August 1st, 2019 by Roy W. Spencer, Ph. D.

The Version 6.0 global average lower tropospheric temperature (LT) anomaly for July, 2019 was +0.38 deg. C, down from the June, 2019 value of +0.47 deg. C:

LINK
============================

I posted these two blog postings to show that the Media who gushes over heatwaves as if they were disasterous, when in reality were largely contaminated by UHI effects. Most of the "records" are being measured in the big cities where UHI is large and not accounted for. here is a Satellite map from space showing obvious UHI effects, where the big cities are hot and the surrounding region distinctly cooler.

View attachment 272576

LINK

Selected excerpt:

"ECOSTRESS mapped the surface, or ground temperature, of four European cities - Rome, Paris, Madrid and Milan - during the mornings of June 27 and June 28.In the images, hotter temperatures appear in red and cooler temperatures appear in blue. They show how the central core of each city is much hotter than the surrounding natural landscape due to the urban heat island effect - a result of urban surfaces storing and re-radiating heat throughout the day.

The fact that surface temperatures were as high as 77-86 degrees Fahrenheit (25-30 degrees Celsius) in the early morning indicates that much of the heat from previous days was stored by surfaces with high heat capacity (such as asphalt, concrete and water bodies) and unable to dissipate before the next day. The trapped heat resulted in even higher midday temperatures, in the high 40s (Celsius) in some places, as the heat wave continued."

=================================================

The media along with warmists needs to stop the lies, account for the UHI effects better and start using the RURAL temperate database sets instead, to help avoid most of the Urban heating effect on thermometers.

You must have had to dig to find that fact because the first thing your link says is

Europe's massive heat wave is on its way out - and it's leaving a slew of broken temperature records in its wake. Many countries were gripped by temperatures above 104 Fahrenheit (40 degrees Celsius) between June 26 and June 30. According to the World Meteorological Organization, June 2019 is now the hottest month on record for the continent as a whole.
 
From Global Warming

July 2019 Was Not the Warmest on Record

August 2nd, 2019 by Roy W. Spencer, Ph. D.

EXCERPT:

July 2019 was probably the 4th warmest of the last 41 years. Global “reanalysis” datasets need to start being used for monitoring of global surface temperatures. [NOTE: It turns out that the WMO, which announced July 2019 as a near-record, relies upon the ERA5 reanalysis which apparently departs substantially from the CFSv2 reanalysis, making my proposed reliance on only reanalysis data for surface temperature monitoring also subject to considerable uncertainty].

and

"(1) The urban heat island (UHI) effect has caused a gradual warming of most land thermometer sites due to encroachment of buildings, parking lots, air conditioning units, vehicles, etc. These effects are localized, not indicative of most of the global land surface (which remains most rural), and not caused by increasing carbon dioxide in the atmosphere. Because UHI warming “looks like” global warming, it is difficult to remove from the data. In fact, NOAA’s efforts to make UHI-contaminated data look like rural data seems to have had the opposite effect. The best strategy would be to simply use only the best (most rural) sited thermometers. This is currently not done."

LINK

===

Here is his other blog post showing the UAH temperature data, that has a .09C COOLING from June:

UAH Global Temperature Update for July, 2019: +0.38 deg. C
August 1st, 2019 by Roy W. Spencer, Ph. D.

The Version 6.0 global average lower tropospheric temperature (LT) anomaly for July, 2019 was +0.38 deg. C, down from the June, 2019 value of +0.47 deg. C:

LINK
============================

I posted these two blog postings to show that the Media who gushes over heatwaves as if they were disasterous, when in reality were largely contaminated by UHI effects. Most of the "records" are being measured in the big cities where UHI is large and not accounted for. here is a Satellite map from space showing obvious UHI effects, where the big cities are hot and the surrounding region distinctly cooler.

View attachment 272576

LINK

Selected excerpt:

"ECOSTRESS mapped the surface, or ground temperature, of four European cities - Rome, Paris, Madrid and Milan - during the mornings of June 27 and June 28.In the images, hotter temperatures appear in red and cooler temperatures appear in blue. They show how the central core of each city is much hotter than the surrounding natural landscape due to the urban heat island effect - a result of urban surfaces storing and re-radiating heat throughout the day.

The fact that surface temperatures were as high as 77-86 degrees Fahrenheit (25-30 degrees Celsius) in the early morning indicates that much of the heat from previous days was stored by surfaces with high heat capacity (such as asphalt, concrete and water bodies) and unable to dissipate before the next day. The trapped heat resulted in even higher midday temperatures, in the high 40s (Celsius) in some places, as the heat wave continued."

=================================================

The media along with warmists needs to stop the lies, account for the UHI effects better and start using the RURAL temperate database sets instead, to help avoid most of the Urban heating effect on thermometers.

This means nothing. What you are trying to suggest is that because this July isn't the hottest on record that global warming doesn't exist?

That would be like me saying Trump is a complete failure because he had horrible jobs numbers in May

The May jobs report is a big disappointment for workers and bad news for Trump

Employers added a scant 75,000 new jobs to the US economy in May — far below last year’s monthly average of 223,000 positions, according to the latest jobs report from the Bureau of Labor Statistics.

Forget about June and July jobs numbers. They don't mean anything. Just focus on May. Based on May numbers, Trump is failing BIGLY.
 
Not according to NOAA..Wikipedia incorrectly names two tropical depressions that never made hurricane status... Now that's damn funny....
You just moved the goal posts. Suddenly "named storms" isn't good enough; now it's "hurricane".
You are a moron.... Naming storms under category 1 is just 10 years old. IT was the alarmist who changed the matrix so they could hype the number of storms. Its been a ruse for a long time.
What does the length of time they've been naming storms have to do with it? The storm WAS named and the poster that said there haven't been any is the real moron. How about Barry? It definitely WAS a hurricane.
Prior to 2010 the naming of storms only occurred when they reached 75mph and category 1 status. Today they are naming tropical depressions. This improperly inflates the numbers of storms. If we look only at the data of all these, the numbers drop rapidly to normal creation numbers seen over the last 150 years.
Barry WAS a hurricane, so all this other stuff is just a smokescreen to cover up the fact that the claim was there were no named storms. Your info, while interesting, is irrelevant to the discussion. Over and out.

I knew from the start that billy bob was wrong about the two storms, he knows it too but it is understandable when the Tropical Storm season is gosh darned quiet this year!

Subtropical Storm Andrea was sooo brief that I would NOT be surprised that most people never heard of it, after all it was only a 24 hours long Subtropical storm...., and far out in the Atlantic.

Hurricane Barry was a minimum Hurricane storm, for about 3 hours, with just 4 days existence, from start to finish, getting little coverage in the process.

Meanwhile YOU were wrong about these two storms several times, which is why I though about this word HYPOCRISTY when thinking about your blatant errors here, that I had to correct several times, and bobs understandable mistake you keep attacking him on.

Suggest that you drop your broken harrow and move on.
 
Last edited:
From Global Warming

July 2019 Was Not the Warmest on Record

August 2nd, 2019 by Roy W. Spencer, Ph. D.

EXCERPT:

July 2019 was probably the 4th warmest of the last 41 years. Global “reanalysis” datasets need to start being used for monitoring of global surface temperatures. [NOTE: It turns out that the WMO, which announced July 2019 as a near-record, relies upon the ERA5 reanalysis which apparently departs substantially from the CFSv2 reanalysis, making my proposed reliance on only reanalysis data for surface temperature monitoring also subject to considerable uncertainty].

and

"(1) The urban heat island (UHI) effect has caused a gradual warming of most land thermometer sites due to encroachment of buildings, parking lots, air conditioning units, vehicles, etc. These effects are localized, not indicative of most of the global land surface (which remains most rural), and not caused by increasing carbon dioxide in the atmosphere. Because UHI warming “looks like” global warming, it is difficult to remove from the data. In fact, NOAA’s efforts to make UHI-contaminated data look like rural data seems to have had the opposite effect. The best strategy would be to simply use only the best (most rural) sited thermometers. This is currently not done."

LINK

===

Here is his other blog post showing the UAH temperature data, that has a .09C COOLING from June:

UAH Global Temperature Update for July, 2019: +0.38 deg. C
August 1st, 2019 by Roy W. Spencer, Ph. D.

The Version 6.0 global average lower tropospheric temperature (LT) anomaly for July, 2019 was +0.38 deg. C, down from the June, 2019 value of +0.47 deg. C:

LINK
============================

I posted these two blog postings to show that the Media who gushes over heatwaves as if they were disasterous, when in reality were largely contaminated by UHI effects. Most of the "records" are being measured in the big cities where UHI is large and not accounted for. here is a Satellite map from space showing obvious UHI effects, where the big cities are hot and the surrounding region distinctly cooler.

View attachment 272576

LINK

Selected excerpt:

"ECOSTRESS mapped the surface, or ground temperature, of four European cities - Rome, Paris, Madrid and Milan - during the mornings of June 27 and June 28.In the images, hotter temperatures appear in red and cooler temperatures appear in blue. They show how the central core of each city is much hotter than the surrounding natural landscape due to the urban heat island effect - a result of urban surfaces storing and re-radiating heat throughout the day.

The fact that surface temperatures were as high as 77-86 degrees Fahrenheit (25-30 degrees Celsius) in the early morning indicates that much of the heat from previous days was stored by surfaces with high heat capacity (such as asphalt, concrete and water bodies) and unable to dissipate before the next day. The trapped heat resulted in even higher midday temperatures, in the high 40s (Celsius) in some places, as the heat wave continued."

=================================================

The media along with warmists needs to stop the lies, account for the UHI effects better and start using the RURAL temperate database sets instead, to help avoid most of the Urban heating effect on thermometers.

You must have had to dig to find that fact because the first thing your link says is

Europe's massive heat wave is on its way out - and it's leaving a slew of broken temperature records in its wake. Many countries were gripped by temperatures above 104 Fahrenheit (40 degrees Celsius) between June 26 and June 30. According to the World Meteorological Organization, June 2019 is now the hottest month on record for the continent as a whole.

Gosh you completely ignored the bottom section of my first post, maybe because you don''t want to address the well known UHI effects on Urban based temperature recording stations. Those Satellite pictures are hard to explain away........, which is why YOU ignored it.

You also avoided talking about this too, from the SAME link:

ECOSTRESS mapped the surface, or ground temperature, of four European cities - Rome, Paris, Madrid and Milan - during the mornings of June 27 and June 28.In the images, hotter temperatures appear in red and cooler temperatures appear in blue. They show how the central core of each city is much hotter than the surrounding natural landscape due to the urban heat island effect - a result of urban surfaces storing and re-radiating heat throughout the day.

The fact that surface temperatures were as high as 77-86 degrees Fahrenheit (25-30 degrees Celsius) in the early morning indicates that much of the heat from previous days was stored by surfaces with high heat capacity (such as asphalt, concrete and water bodies) and unable to dissipate before the next day. The trapped heat resulted in even higher midday temperatures, in the high 40s (Celsius) in some places, as the heat wave continued."

red bolding mine

You can't explain away the UHI effect that was vividly shown in the link......., they elevated the temperature which is why unethical warmists like YOU try hard to ignore it.

Your other post that includes Trump month of MAY (the post one article is for JULY) dumb analogy attempt, is so idiotically dumb and false that I will ignore it. I posted well supported facts and you ignored them, for a cheap off topic attack on Trump, which means you have no argument to make at all about what I posted.
 
You just moved the goal posts. Suddenly "named storms" isn't good enough; now it's "hurricane".
You are a moron.... Naming storms under category 1 is just 10 years old. IT was the alarmist who changed the matrix so they could hype the number of storms. Its been a ruse for a long time.
What does the length of time they've been naming storms have to do with it? The storm WAS named and the poster that said there haven't been any is the real moron. How about Barry? It definitely WAS a hurricane.
Prior to 2010 the naming of storms only occurred when they reached 75mph and category 1 status. Today they are naming tropical depressions. This improperly inflates the numbers of storms. If we look only at the data of all these, the numbers drop rapidly to normal creation numbers seen over the last 150 years.
Barry WAS a hurricane, so all this other stuff is just a smokescreen to cover up the fact that the claim was there were no named storms. Your info, while interesting, is irrelevant to the discussion. Over and out.

I knew from the start that billy bob was wrong about the two storms, he knows it too but it is understandable when the Tropical Storm season is gosh darned quiet this year!

Subtropical Storm Andrea was sooo brief that I would NOT be surprised that most people never heard of it, after all it was only a 24 hours long Subtropical storm...., and far out in the Atlantic.

Hurricane Barry was a minimum Hurricane storm, for around 4 hours, with just 4 days existence, from start to finish, getting little coverage in the process.

Meanwhile YOU were wrong about these two storms several times, which is why I though about this word HYPOCRISTY when thinking about your blatant errors here, that I had to correct several times, and bobs understandable mistake you keep attacking him on.

Suggest that you drop your broken harrow and move on.
These are two storms that should never have been named.... Prior to 2010 they would not have been.
 
LMAO. Historic temp records are not accurate. Cites them as fact when convenient. Satellite imagery of Arctic show polar cap is a wreck and near an all time low. Yet Billy Bob telling us planet is cooling down.

Well if you can't tell it is being caused by all the buildings in the arctic.
 
You just moved the goal posts. Suddenly "named storms" isn't good enough; now it's "hurricane".
You are a moron.... Naming storms under category 1 is just 10 years old. IT was the alarmist who changed the matrix so they could hype the number of storms. Its been a ruse for a long time.
What does the length of time they've been naming storms have to do with it? The storm WAS named and the poster that said there haven't been any is the real moron. How about Barry? It definitely WAS a hurricane.
Prior to 2010 the naming of storms only occurred when they reached 75mph and category 1 status. Today they are naming tropical depressions. This improperly inflates the numbers of storms. If we look only at the data of all these, the numbers drop rapidly to normal creation numbers seen over the last 150 years.
Barry WAS a hurricane, so all this other stuff is just a smokescreen to cover up the fact that the claim was there were no named storms. Your info, while interesting, is irrelevant to the discussion. Over and out.

I knew from the start that billy bob was wrong about the two storms, he knows it too but it is understandable when the Tropical Storm season is gosh darned quiet this year!

Subtropical Storm Andrea was sooo brief that I would NOT be surprised that most people never heard of it, after all it was only a 24 hours long Subtropical storm...., and far out in the Atlantic.

Hurricane Barry was a minimum Hurricane storm, for about 3 hours, with just 4 days existence, from start to finish, getting little coverage in the process.

Meanwhile YOU were wrong about these two storms several times, which is why I though about this word HYPOCRISTY when thinking about your blatant errors here, that I had to correct several times, and bobs understandable mistake you keep attacking him on.

Suggest that you drop your broken harrow and move on.
How was I wrong? All I said was that the storms WERE actually named. You conceded that point, but didn't enumerate the supposed mistakes I made. What gives? Another attempt at misdirection?
 
From Global Warming

July 2019 Was Not the Warmest on Record

August 2nd, 2019 by Roy W. Spencer, Ph. D.

EXCERPT:

July 2019 was probably the 4th warmest of the last 41 years. Global “reanalysis” datasets need to start being used for monitoring of global surface temperatures. [NOTE: It turns out that the WMO, which announced July 2019 as a near-record, relies upon the ERA5 reanalysis which apparently departs substantially from the CFSv2 reanalysis, making my proposed reliance on only reanalysis data for surface temperature monitoring also subject to considerable uncertainty].

and

"(1) The urban heat island (UHI) effect has caused a gradual warming of most land thermometer sites due to encroachment of buildings, parking lots, air conditioning units, vehicles, etc. These effects are localized, not indicative of most of the global land surface (which remains most rural), and not caused by increasing carbon dioxide in the atmosphere. Because UHI warming “looks like” global warming, it is difficult to remove from the data. In fact, NOAA’s efforts to make UHI-contaminated data look like rural data seems to have had the opposite effect. The best strategy would be to simply use only the best (most rural) sited thermometers. This is currently not done."

LINK

===

Here is his other blog post showing the UAH temperature data, that has a .09C COOLING from June:

UAH Global Temperature Update for July, 2019: +0.38 deg. C
August 1st, 2019 by Roy W. Spencer, Ph. D.

The Version 6.0 global average lower tropospheric temperature (LT) anomaly for July, 2019 was +0.38 deg. C, down from the June, 2019 value of +0.47 deg. C:

LINK
============================

I posted these two blog postings to show that the Media who gushes over heatwaves as if they were disasterous, when in reality were largely contaminated by UHI effects. Most of the "records" are being measured in the big cities where UHI is large and not accounted for. here is a Satellite map from space showing obvious UHI effects, where the big cities are hot and the surrounding region distinctly cooler.

View attachment 272576

LINK

Selected excerpt:

"ECOSTRESS mapped the surface, or ground temperature, of four European cities - Rome, Paris, Madrid and Milan - during the mornings of June 27 and June 28.In the images, hotter temperatures appear in red and cooler temperatures appear in blue. They show how the central core of each city is much hotter than the surrounding natural landscape due to the urban heat island effect - a result of urban surfaces storing and re-radiating heat throughout the day.

The fact that surface temperatures were as high as 77-86 degrees Fahrenheit (25-30 degrees Celsius) in the early morning indicates that much of the heat from previous days was stored by surfaces with high heat capacity (such as asphalt, concrete and water bodies) and unable to dissipate before the next day. The trapped heat resulted in even higher midday temperatures, in the high 40s (Celsius) in some places, as the heat wave continued."

=================================================

The media along with warmists needs to stop the lies, account for the UHI effects better and start using the RURAL temperate database sets instead, to help avoid most of the Urban heating effect on thermometers.

You must have had to dig to find that fact because the first thing your link says is

Europe's massive heat wave is on its way out - and it's leaving a slew of broken temperature records in its wake. Many countries were gripped by temperatures above 104 Fahrenheit (40 degrees Celsius) between June 26 and June 30. According to the World Meteorological Organization, June 2019 is now the hottest month on record for the continent as a whole.

Gosh you completely ignored the bottom section of my first post, maybe because you don''t want to address the well known UHI effects on Urban based temperature recording stations. Those Satellite pictures are hard to explain away........, which is why YOU ignored it.

You also avoided talking about this too, from the SAME link:

ECOSTRESS mapped the surface, or ground temperature, of four European cities - Rome, Paris, Madrid and Milan - during the mornings of June 27 and June 28.In the images, hotter temperatures appear in red and cooler temperatures appear in blue. They show how the central core of each city is much hotter than the surrounding natural landscape due to the urban heat island effect - a result of urban surfaces storing and re-radiating heat throughout the day.

The fact that surface temperatures were as high as 77-86 degrees Fahrenheit (25-30 degrees Celsius) in the early morning indicates that much of the heat from previous days was stored by surfaces with high heat capacity (such as asphalt, concrete and water bodies) and unable to dissipate before the next day. The trapped heat resulted in even higher midday temperatures, in the high 40s (Celsius) in some places, as the heat wave continued."

red bolding mine

You can't explain away the UHI effect that was vividly shown in the link......., they elevated the temperature which is why unethical warmists like YOU try hard to ignore it.

Your other post that includes Trump month of MAY (the post one article is for JULY) dumb analogy attempt, is so idiotically dumb and false that I will ignore it. I posted well supported facts and you ignored them, for a cheap off topic attack on Trump, which means you have no argument to make at all about what I posted.


They eliminated thousands of rural stations so that the UHI would be magnified in the data..
 
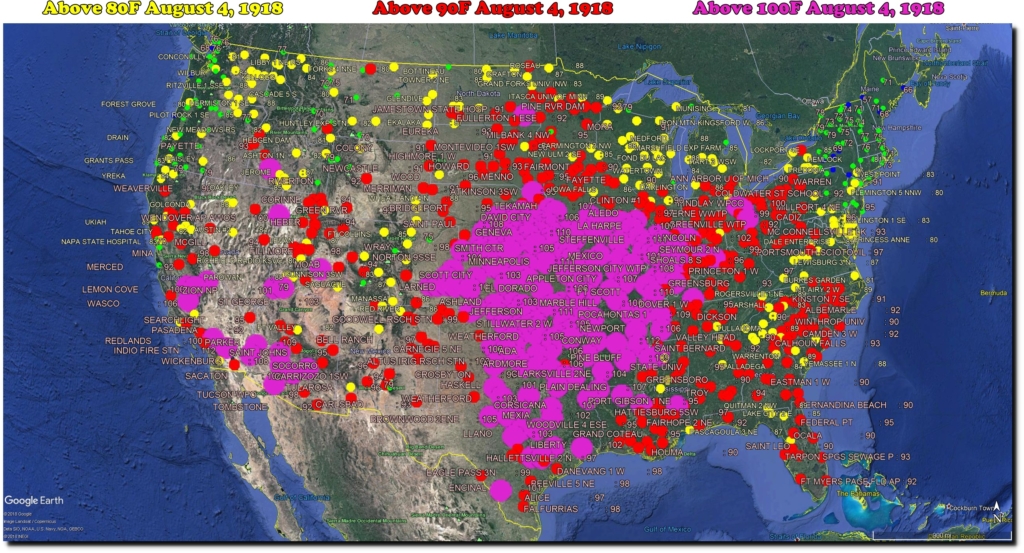
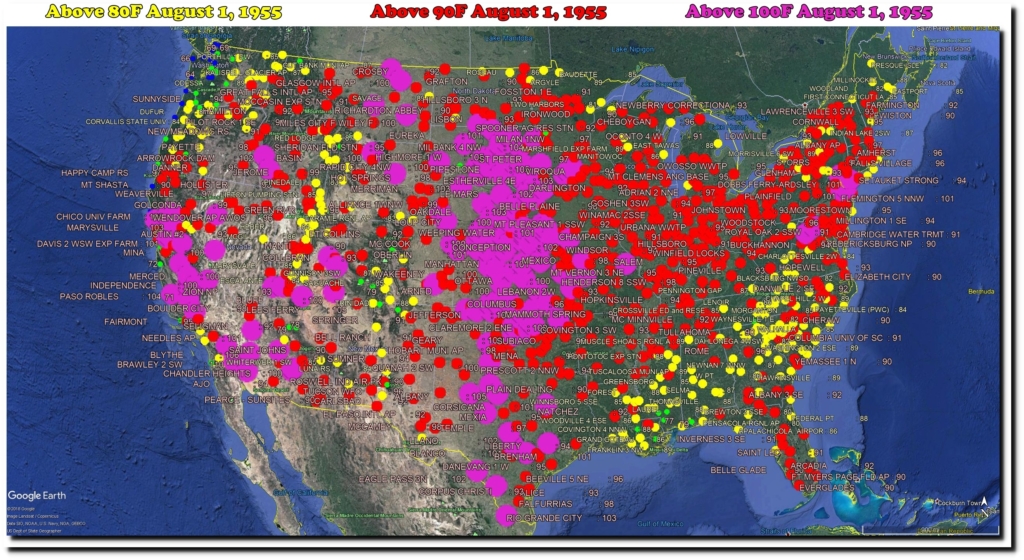
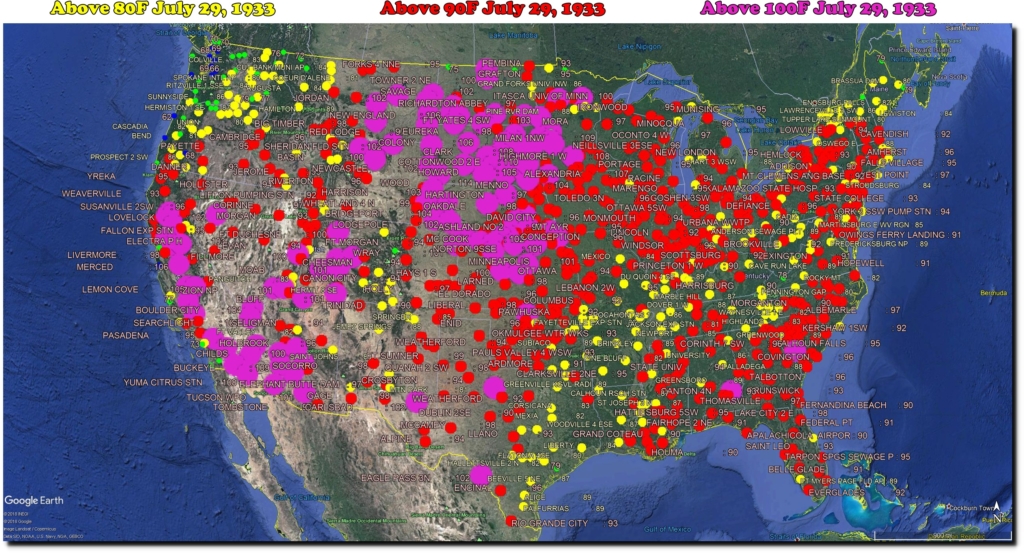
Here are some real heatwaves of the past we used to get, something that has become rare these days. The following from Real climate science:

"Temperatures topped out at 113 degrees at Clarinda, Iowa on August 4, 1918.


LINK

and,

"On this date in 1955, every state was over 90 degrees (32C) and 20 states were over 100 degrees (38C.) Hot weather like that is incomprehensible now.


LINK

and,

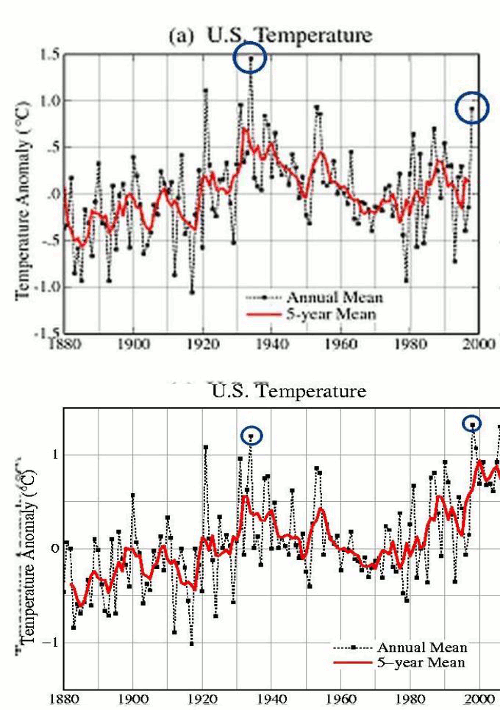
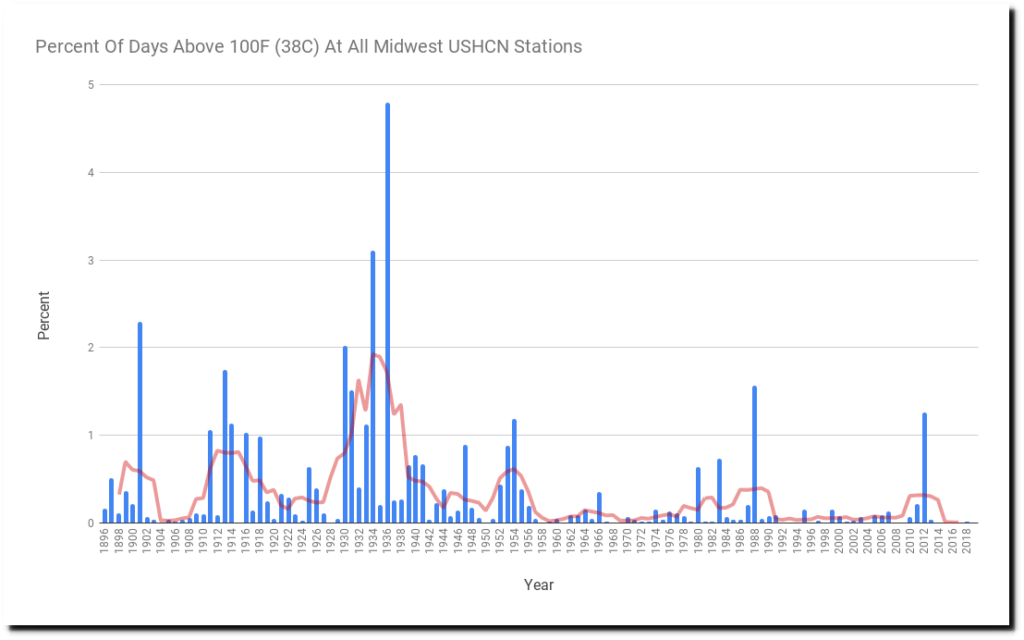
"This year (so far) is only the third year since 1895 to post no 100 degree temperatures in the Midwest. The other two were 1928 and 1992 (after the eruption of Mt. Pinatubo.) The likelihood of 100 degree weather has plummeted over the past century.


LINK

and,

"On this date in 1933, it was 109 degrees at Milan Minnesota – which was 37 degrees warmer than today. Gann Valley, South Dakota was 115 degrees on that date – which was 36 degrees warmer than today.


Many more charts in the LINK

There are many more like this that used to be terrible heatwaves, now the heatwaves we get now are cooler and smaller in area, yet warmists who chronically ignore anything before the 1950, sees doom around every 95-100 degree days.

DENIER!!! DENIER!!! Your "Charts" are deniers and need to be adjusted downward
join_in_the_internet_circle_jerk_print-ra11ce31c7e7d40d78d37d8a5a1e777f5_zod_400.jpg
 
From Global Warming

July 2019 Was Not the Warmest on Record

August 2nd, 2019 by Roy W. Spencer, Ph. D.

EXCERPT:

July 2019 was probably the 4th warmest of the last 41 years. Global “reanalysis” datasets need to start being used for monitoring of global surface temperatures. [NOTE: It turns out that the WMO, which announced July 2019 as a near-record, relies upon the ERA5 reanalysis which apparently departs substantially from the CFSv2 reanalysis, making my proposed reliance on only reanalysis data for surface temperature monitoring also subject to considerable uncertainty].

and

"(1) The urban heat island (UHI) effect has caused a gradual warming of most land thermometer sites due to encroachment of buildings, parking lots, air conditioning units, vehicles, etc. These effects are localized, not indicative of most of the global land surface (which remains most rural), and not caused by increasing carbon dioxide in the atmosphere. Because UHI warming “looks like” global warming, it is difficult to remove from the data. In fact, NOAA’s efforts to make UHI-contaminated data look like rural data seems to have had the opposite effect. The best strategy would be to simply use only the best (most rural) sited thermometers. This is currently not done."

LINK

===

Here is his other blog post showing the UAH temperature data, that has a .09C COOLING from June:

UAH Global Temperature Update for July, 2019: +0.38 deg. C
August 1st, 2019 by Roy W. Spencer, Ph. D.

The Version 6.0 global average lower tropospheric temperature (LT) anomaly for July, 2019 was +0.38 deg. C, down from the June, 2019 value of +0.47 deg. C:

LINK
============================

I posted these two blog postings to show that the Media who gushes over heatwaves as if they were disasterous, when in reality were largely contaminated by UHI effects. Most of the "records" are being measured in the big cities where UHI is large and not accounted for. here is a Satellite map from space showing obvious UHI effects, where the big cities are hot and the surrounding region distinctly cooler.

View attachment 272576

LINK

Selected excerpt:

"ECOSTRESS mapped the surface, or ground temperature, of four European cities - Rome, Paris, Madrid and Milan - during the mornings of June 27 and June 28.In the images, hotter temperatures appear in red and cooler temperatures appear in blue. They show how the central core of each city is much hotter than the surrounding natural landscape due to the urban heat island effect - a result of urban surfaces storing and re-radiating heat throughout the day.

The fact that surface temperatures were as high as 77-86 degrees Fahrenheit (25-30 degrees Celsius) in the early morning indicates that much of the heat from previous days was stored by surfaces with high heat capacity (such as asphalt, concrete and water bodies) and unable to dissipate before the next day. The trapped heat resulted in even higher midday temperatures, in the high 40s (Celsius) in some places, as the heat wave continued."

=================================================

The media along with warmists needs to stop the lies, account for the UHI effects better and start using the RURAL temperate database sets instead, to help avoid most of the Urban heating effect on thermometers.

You must have had to dig to find that fact because the first thing your link says is

Europe's massive heat wave is on its way out - and it's leaving a slew of broken temperature records in its wake. Many countries were gripped by temperatures above 104 Fahrenheit (40 degrees Celsius) between June 26 and June 30. According to the World Meteorological Organization, June 2019 is now the hottest month on record for the continent as a whole.

Gosh you completely ignored the bottom section of my first post, maybe because you don''t want to address the well known UHI effects on Urban based temperature recording stations. Those Satellite pictures are hard to explain away........, which is why YOU ignored it.

You also avoided talking about this too, from the SAME link:

ECOSTRESS mapped the surface, or ground temperature, of four European cities - Rome, Paris, Madrid and Milan - during the mornings of June 27 and June 28.In the images, hotter temperatures appear in red and cooler temperatures appear in blue. They show how the central core of each city is much hotter than the surrounding natural landscape due to the urban heat island effect - a result of urban surfaces storing and re-radiating heat throughout the day.

The fact that surface temperatures were as high as 77-86 degrees Fahrenheit (25-30 degrees Celsius) in the early morning indicates that much of the heat from previous days was stored by surfaces with high heat capacity (such as asphalt, concrete and water bodies) and unable to dissipate before the next day. The trapped heat resulted in even higher midday temperatures, in the high 40s (Celsius) in some places, as the heat wave continued."

red bolding mine

You can't explain away the UHI effect that was vividly shown in the link......., they elevated the temperature which is why unethical warmists like YOU try hard to ignore it.

Your other post that includes Trump month of MAY (the post one article is for JULY) dumb analogy attempt, is so idiotically dumb and false that I will ignore it. I posted well supported facts and you ignored them, for a cheap off topic attack on Trump, which means you have no argument to make at all about what I posted.
Because that shit don’t matter.

You miss the comparison and point. Just because one month isn’t the hottest on record, that proves nothing.

What does science say about what you’re saying? Is there consensus?
 

Forum List

Back
Top