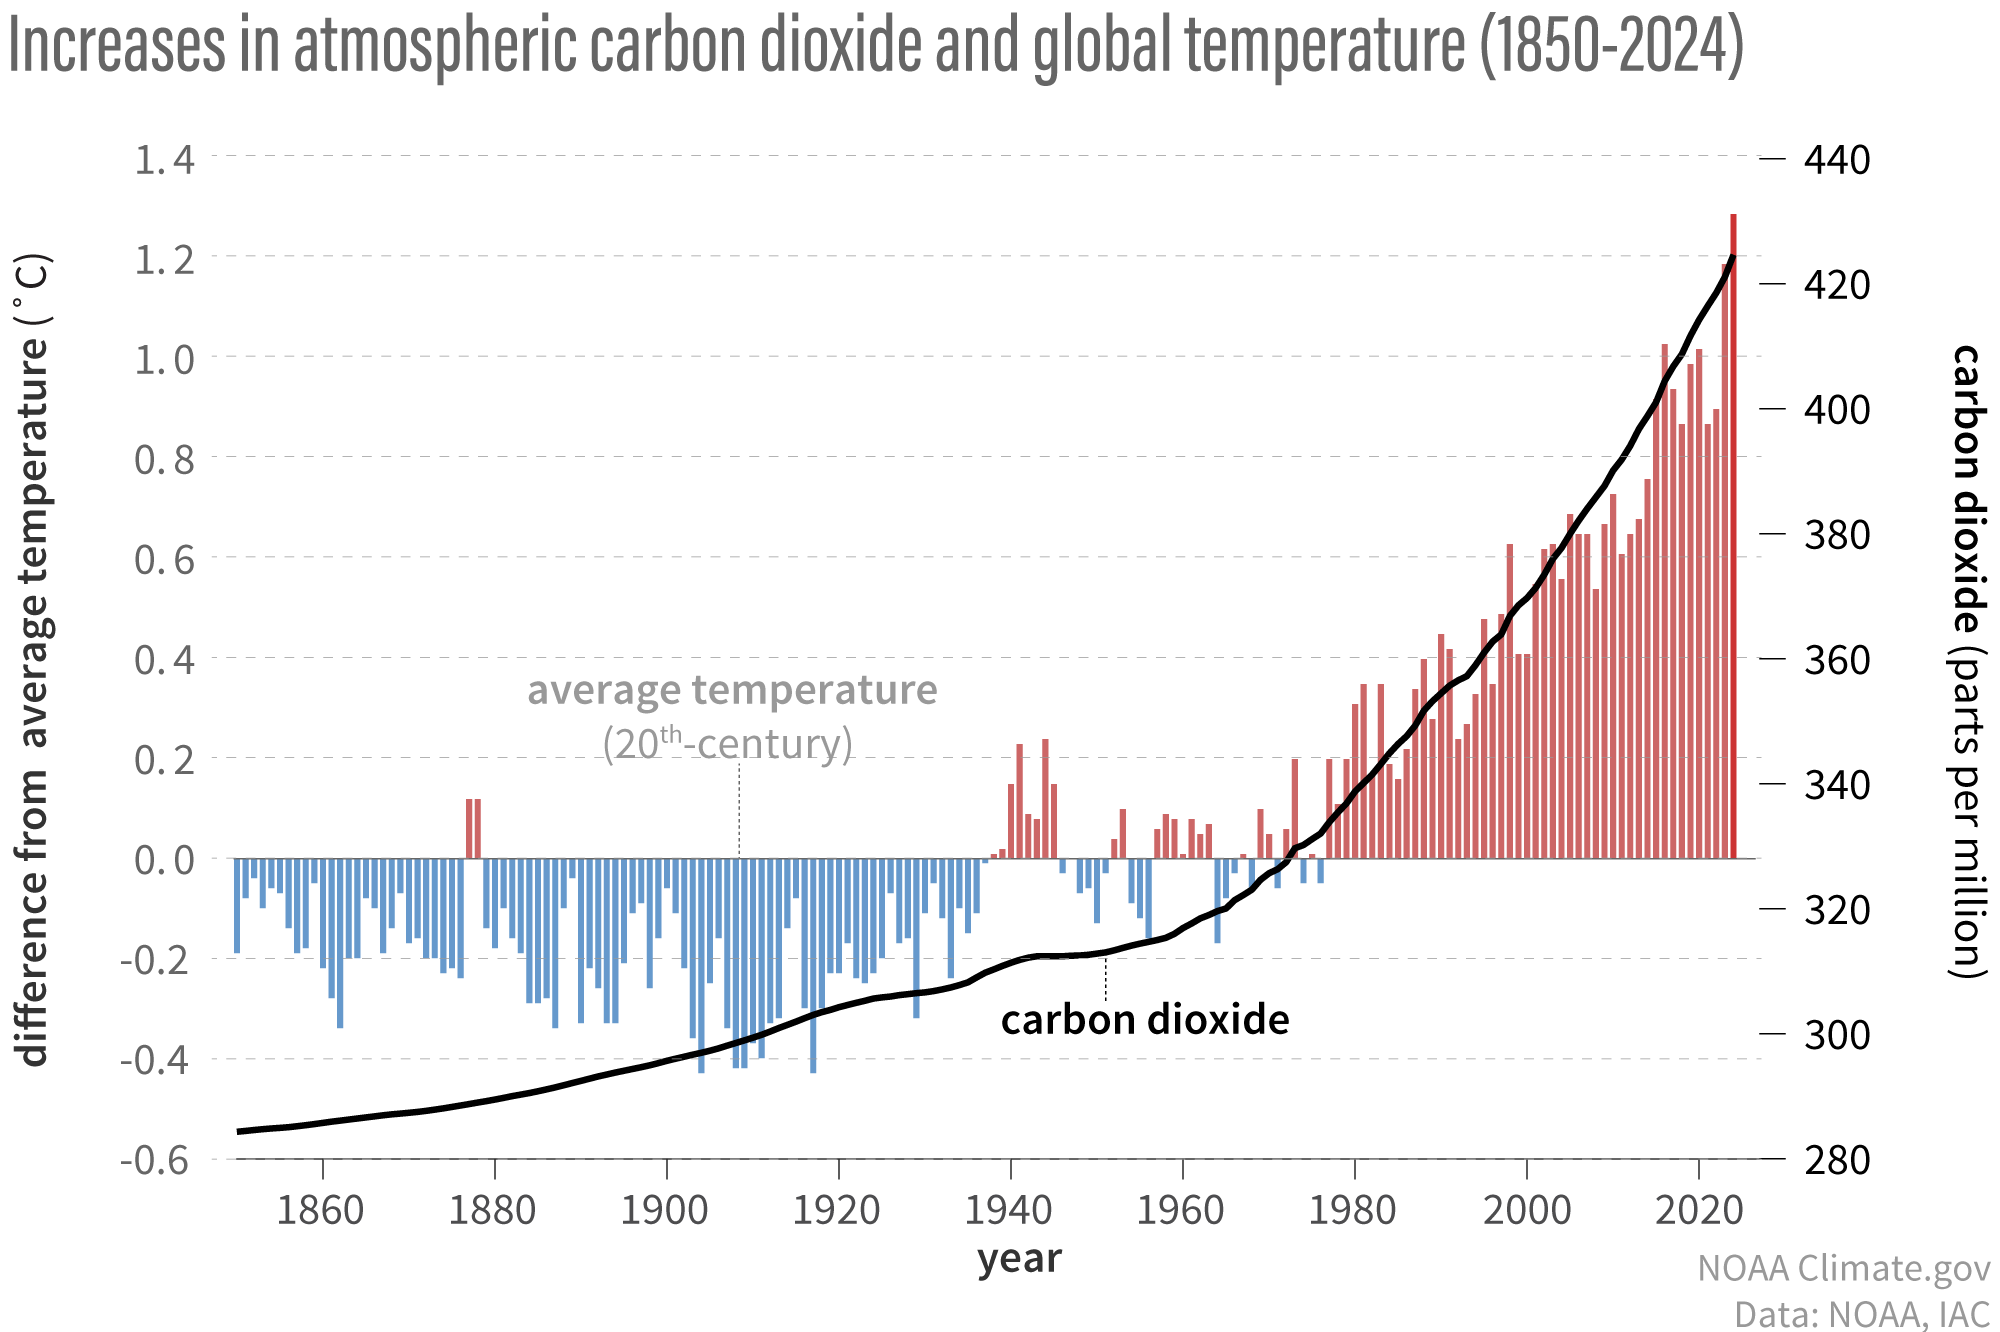
Why would you need a crossplot to see the relationships between only two parameters? Where is "the empirical evidence" in a crossplot of CO2 and temperature?Crossplot post industrial revolution atmospheric CO2 against temperature and you will see that the empirical climate evidence does not support temperature being a function of CO2.
Navigation
Install the app
How to install the app on iOS
Follow along with the video below to see how to install our site as a web app on your home screen.
Note: This feature may not be available in some browsers.
More options
Style variation
You are using an out of date browser. It may not display this or other websites correctly.
You should upgrade or use an alternative browser.
You should upgrade or use an alternative browser.
How do we Know Human are Causing Climate Change?
- Thread starter abu afak
- Start date
My "Why?" was in response to your "double-dog dare" regarding your rhetorical query as to "Climate fluctuations and environmental uncertainty are hallmarks of our bipolar glaciated planet". Your response here does NOT answer that query. You get one more chance. Why are climate fluctuations and environmental uncertainty hallmarks of our bipolar (and what planet lacks two poles?) glaciated planet?Because the poles have different thresholds for glaciation.
Answer your double dog dare first child.Do you know why they do?
jc456
Diamond Member
- Dec 18, 2013
- 160,748
- 40,279
- 2,180
What it means is we’re still in an ice ageOf course not, but the transient ones covering north America, like Minesota, Wisconsin, Iowa, Illinois, Ohio, etc. did melt off.
jc456
Diamond Member
- Dec 18, 2013
- 160,748
- 40,279
- 2,180
All data shows co2 lags temperatures. Closes your nonsenseWhy would you need a crossplot to see the relationships between only two parameters? Where is "the empirical evidence" in a crossplot of CO2 and temperature?
When I was working we made a variety of data plots. The most common were bearing error vs actual relative bearing and range error vs actual range. But at one point one of my coworkers discovered that plotting bearing error vs bearing rate or range error vs range rate would reveal timing errors. Any dependence of the bearing error on bearing rate or range error on the range rate, indicated a timing error in the fire control system, where our data were coming from. And these were cross plots of only two parameters, though bearing and range rates were calculated.Why would you need a crossplot to see the relationships between only two parameters? Where is "the empirical evidence" in a crossplot of CO2 and temperature?
You, Ding, seem to be claiming (and this is the frustrating part - that we always have to try to figure out what you're not saying) that crossplotting these two will refute the very strong correlation all the rest of climate science has found between CO2 and temperature. But if that's what you believe, you're going to have to say it and then demonstrate it.
jc456
Diamond Member
- Dec 18, 2013
- 160,748
- 40,279
- 2,180
When I was working we made a variety of data plots. The most common were bearing error vs actual relative bearing and range error vs actual range. But at one point one of my coworkers discovered that plotting bearing error vs bearing rate or range error vs range rate would reveal timing errors. Any dependence of the bearing error on bearing rate or range error on the range rate, indicated a timing error in the fire control system, where our data were coming from. And these were cross plots of only two parameters, though bearing and range rates were calculated.
You, Ding, seem to be claiming (and this is the frustrating part - that we always have to try to figure out what you're not saying) that crossplotting these two will refute the very strong correlation all the rest of climate science has found between CO2 and temperature. But if that's what you believe, you're going to have to say it and then demonstrate it.
Grumblenuts
Gold Member
- Oct 16, 2017
- 16,066
- 5,544
- 210
jc456
Diamond Member
- Dec 18, 2013
- 160,748
- 40,279
- 2,180
It’s hilarious to me that climate nutters don’t understand winter vs summer and the tilt of the planet
It's anything but funny how poorly you understand fundamental science presented in as clear a manner as that. Does your summer take 41,000 years to come on?It’s hilarious to me that climate nutters don’t understand winter vs summer and the tilt of the planet
jc456
Diamond Member
- Dec 18, 2013
- 160,748
- 40,279
- 2,180
Are the poles ice free?It's anything but funny how poorly you understand fundamental science presented in as clear a manner as that. Does your summer take 41,000 years to come on?
Trolling is all you have ever known how to do. How many times has management had to speak to you about that?Are the poles ice free?
jc456
Diamond Member
- Dec 18, 2013
- 160,748
- 40,279
- 2,180
Get on topic! We know humans aren’t responsible because the poles still have ice!!Trolling is all you have ever known how to do. How many times has management had to speak to you about that?
It certainly does. It just went over your head.I'm afraid that doesn't address anything he actually said.
Because it is the crossplotting of the data that proves a functional relationship exists in reality and can empirically quantify that relationship. You can crossplot carbon emissions versus CO2 and see that post industrial revolution that atmospheric CO2 is a function of carbon emissions; determine the empirical relationship; and use the empirically derived formula to make accurate future predictions based upon the empirically derived relationship and formula. You can do the exact same thing for pre-industrial revolution but prior to that atmospheric CO2 was a function of temperature.Why would you need a crossplot to see the relationships between only two parameters? Where is "the empirical evidence" in a crossplot of CO2 and temperature?
That's why crossplotting is done everywhere else but here.
Sure it did. That went over your head too. 50 million years of the planet cooling and transitioning from a greenhouse planet to an icehouse planet will not be reversed by 200 years of increased CO2 emissions. And that's why no one on your idiotic team has ever dared to crossplot the last 200 years of atmospheric CO2 versus temperature. Because the data does not support your idiotic beliefs.My "Why?" was in response to your "double-dog dare" regarding your rhetorical query as to "Climate fluctuations and environmental uncertainty are hallmarks of our bipolar glaciated planet". Your response here does NOT answer that query. You get one more chance. Why are climate fluctuations and environmental uncertainty hallmarks of our bipolar (and what planet lacks two poles?) glaciated planet?
Answer your double dog dare first child.
Go ahead and provide me with 200 years of CO2 and temperature data you will accept as valid data and I will show you what an idiot your are by crossplotting this data and comparing it the pre-industrial revolution CO2 and temperature data.
Give me 200 years of data that you accept as valid and I will show you what an idiot you are.When I was working we made a variety of data plots. The most common were bearing error vs actual relative bearing and range error vs actual range. But at one point one of my coworkers discovered that plotting bearing error vs bearing rate or range error vs range rate would reveal timing errors. Any dependence of the bearing error on bearing rate or range error on the range rate, indicated a timing error in the fire control system, where our data were coming from. And these were cross plots of only two parameters, though bearing and range rates were calculated.
You, Ding, seem to be claiming (and this is the frustrating part - that we always have to try to figure out what you're not saying) that crossplotting these two will refute the very strong correlation all the rest of climate science has found between CO2 and temperature. But if that's what you believe, you're going to have to say it and then demonstrate it.
Give me 200 years of data that you accept as valid and I will show you what an idiot you are.
Search Records | Plymouth County Registry
The Registry of Deeds offers free off-site access to Registry information called TitleView. Printing is available only by having a subscription(Titleview).
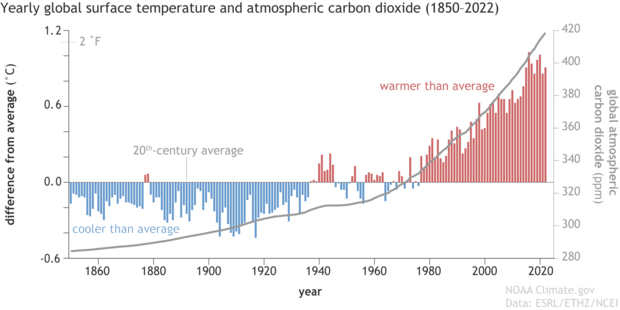
You have stated on numerous occasions that the correlation between CO2 and temperature is weak or non-existent. Mainstream science believes the opposite. You'll have to forgive me if I go with mainstream science.

The correlation between CO2 and temperature
This week, Australian TV channel ABC aired an interview with Australian senator Steve Fielding. The senator is studying both sides of the debate and genuinely seems to be struggling with the question of whether man is causing global warming. He found particularly persuasive the argument that in...
skepticalscience.com
The CO2/Temperature correlation over the 20th Century
Previously, we looked at the correlation between CO2 and temperature over the past 40 years. However, as I'm always saying, you need to look at the broader view, not just a single piece of the puzzle. The 40 year period was chosen to demonstrate that even during a period of long term warming...
skepticalscience.com
If carbon dioxide hits a new high every year, why isn’t every year hotter than the last?
Thanks to the global oceans, Earth's surface temperature doesn't react instantly to the full impact of a climate disturbance. That delayed reaction has pros and cons.


Does the high coefficient of determination in this graph predict a huge spike in global warming?
I have had three semesters of college statistics as part of my BSBA degree. From what I recall from regression analysis the graph seems to show a very high coefficient of determination between CO2 ...
 stats.stackexchange.com
jc456
Diamond Member
- Dec 18, 2013
- 160,748
- 40,279
- 2,180
ExceptSearch Records | Plymouth County Registry
The Registry of Deeds offers free off-site access to Registry information called TitleView. Printing is available only by having a subscription(Titleview).www.plymouthdeeds.org
You have stated on numerous occasions that the correlation between CO2 and temperature is weak or non-existent. Mainstream science believes the opposite. You'll have to forgive me if I go with mainstream science.
The correlation between CO2 and temperature
This week, Australian TV channel ABC aired an interview with Australian senator Steve Fielding. The senator is studying both sides of the debate and genuinely seems to be struggling with the question of whether man is causing global warming. He found particularly persuasive the argument that in...skepticalscience.com
The CO2/Temperature correlation over the 20th Century
Previously, we looked at the correlation between CO2 and temperature over the past 40 years. However, as I'm always saying, you need to look at the broader view, not just a single piece of the puzzle. The 40 year period was chosen to demonstrate that even during a period of long term warming...skepticalscience.com
If carbon dioxide hits a new high every year, why isn’t every year hotter than the last?
Thanks to the global oceans, Earth's surface temperature doesn't react instantly to the full impact of a climate disturbance. That delayed reaction has pros and cons.www.climate.gov
Does the high coefficient of determination in this graph predict a huge spike in global warming?
I have had three semesters of college statistics as part of my BSBA degree. From what I recall from regression analysis the graph seems to show a very high coefficient of determination between CO2 ...

Climate myths: Ice cores show CO<sub>2</sub> increases lag behind temperature rises, disproving the link to global warming
The lag proves that rising CO2 did not cause the initial warming as past ice ages ended, but it does not in any way contradict the idea that higher CO2 levels cause warming.
 www.newscientist.com
EMH
Diamond Member
- Apr 5, 2021
- 33,180
- 19,423
- 2,788
What the atmospheric data really said and the laughable excuses the warmers used to FUDGE IT...
NO WARMING = THEORY REJECTED
no no no just FUDGE IT...

 www.nbcnews.com
The correlation between Co2 and atmospheric temperature is precisely
0.0000000000000000000000000000000000000
NO WARMING = THEORY REJECTED
no no no just FUDGE IT...
Key claim against global warming evaporates
Satellite and weather balloon data used to argue that climate models were wrong and that global warming isn't really happening turns out to be based on faulty analyses, according to three new studies.
www.nbcnews.com
The correlation between Co2 and atmospheric temperature is precisely
0.0000000000000000000000000000000000000
None of those are crossplots. You literally have to plot CO2 versus temperature. Provide the data that is acceptable to you and I will crossplot it for you because you don't seem capable of doing so yourself.Search Records | Plymouth County Registry
The Registry of Deeds offers free off-site access to Registry information called TitleView. Printing is available only by having a subscription(Titleview).
You have stated on numerous occasions that the correlation between CO2 and temperature is weak or non-existent. Mainstream science believes the opposite. You'll have to forgive me if I go with mainstream science.
The correlation between CO2 and temperature
This week, Australian TV channel ABC aired an interview with Australian senator Steve Fielding. The senator is studying both sides of the debate and genuinely seems to be struggling with the question of whether man is causing global warming. He found particularly persuasive the argument that in...skepticalscience.com
The CO2/Temperature correlation over the 20th Century
Previously, we looked at the correlation between CO2 and temperature over the past 40 years. However, as I'm always saying, you need to look at the broader view, not just a single piece of the puzzle. The 40 year period was chosen to demonstrate that even during a period of long term warming...skepticalscience.com
If carbon dioxide hits a new high every year, why isn’t every year hotter than the last?
Thanks to the global oceans, Earth's surface temperature doesn't react instantly to the full impact of a climate disturbance. That delayed reaction has pros and cons.
Does the high coefficient of determination in this graph predict a huge spike in global warming?
I have had three semesters of college statistics as part of my BSBA degree. From what I recall from regression analysis the graph seems to show a very high coefficient of determination between CO2 ...
Similar threads
- Replies
- 6
- Views
- 214
- Replies
- 126
- Views
- 1K
- Replies
- 274
- Views
- 3K
- Replies
- 138
- Views
- 2K
New Topics
-
 Allright going to play the game. If this guy was black... would he have been dead?
- Started by Yarddog
- Replies: 0
-

-
-
Trump repeats call for Supreme Court to end automatic U.S. birthright citizenship.
- Started by johnwk
- Replies: 13
-
Springdale man leaves kids, aged 5 and 6 months.
- Started by Polishprince
- Replies: 2