Wyatt earp
Diamond Member
- Apr 21, 2012
- 69,975
- 16,447
- 2,180
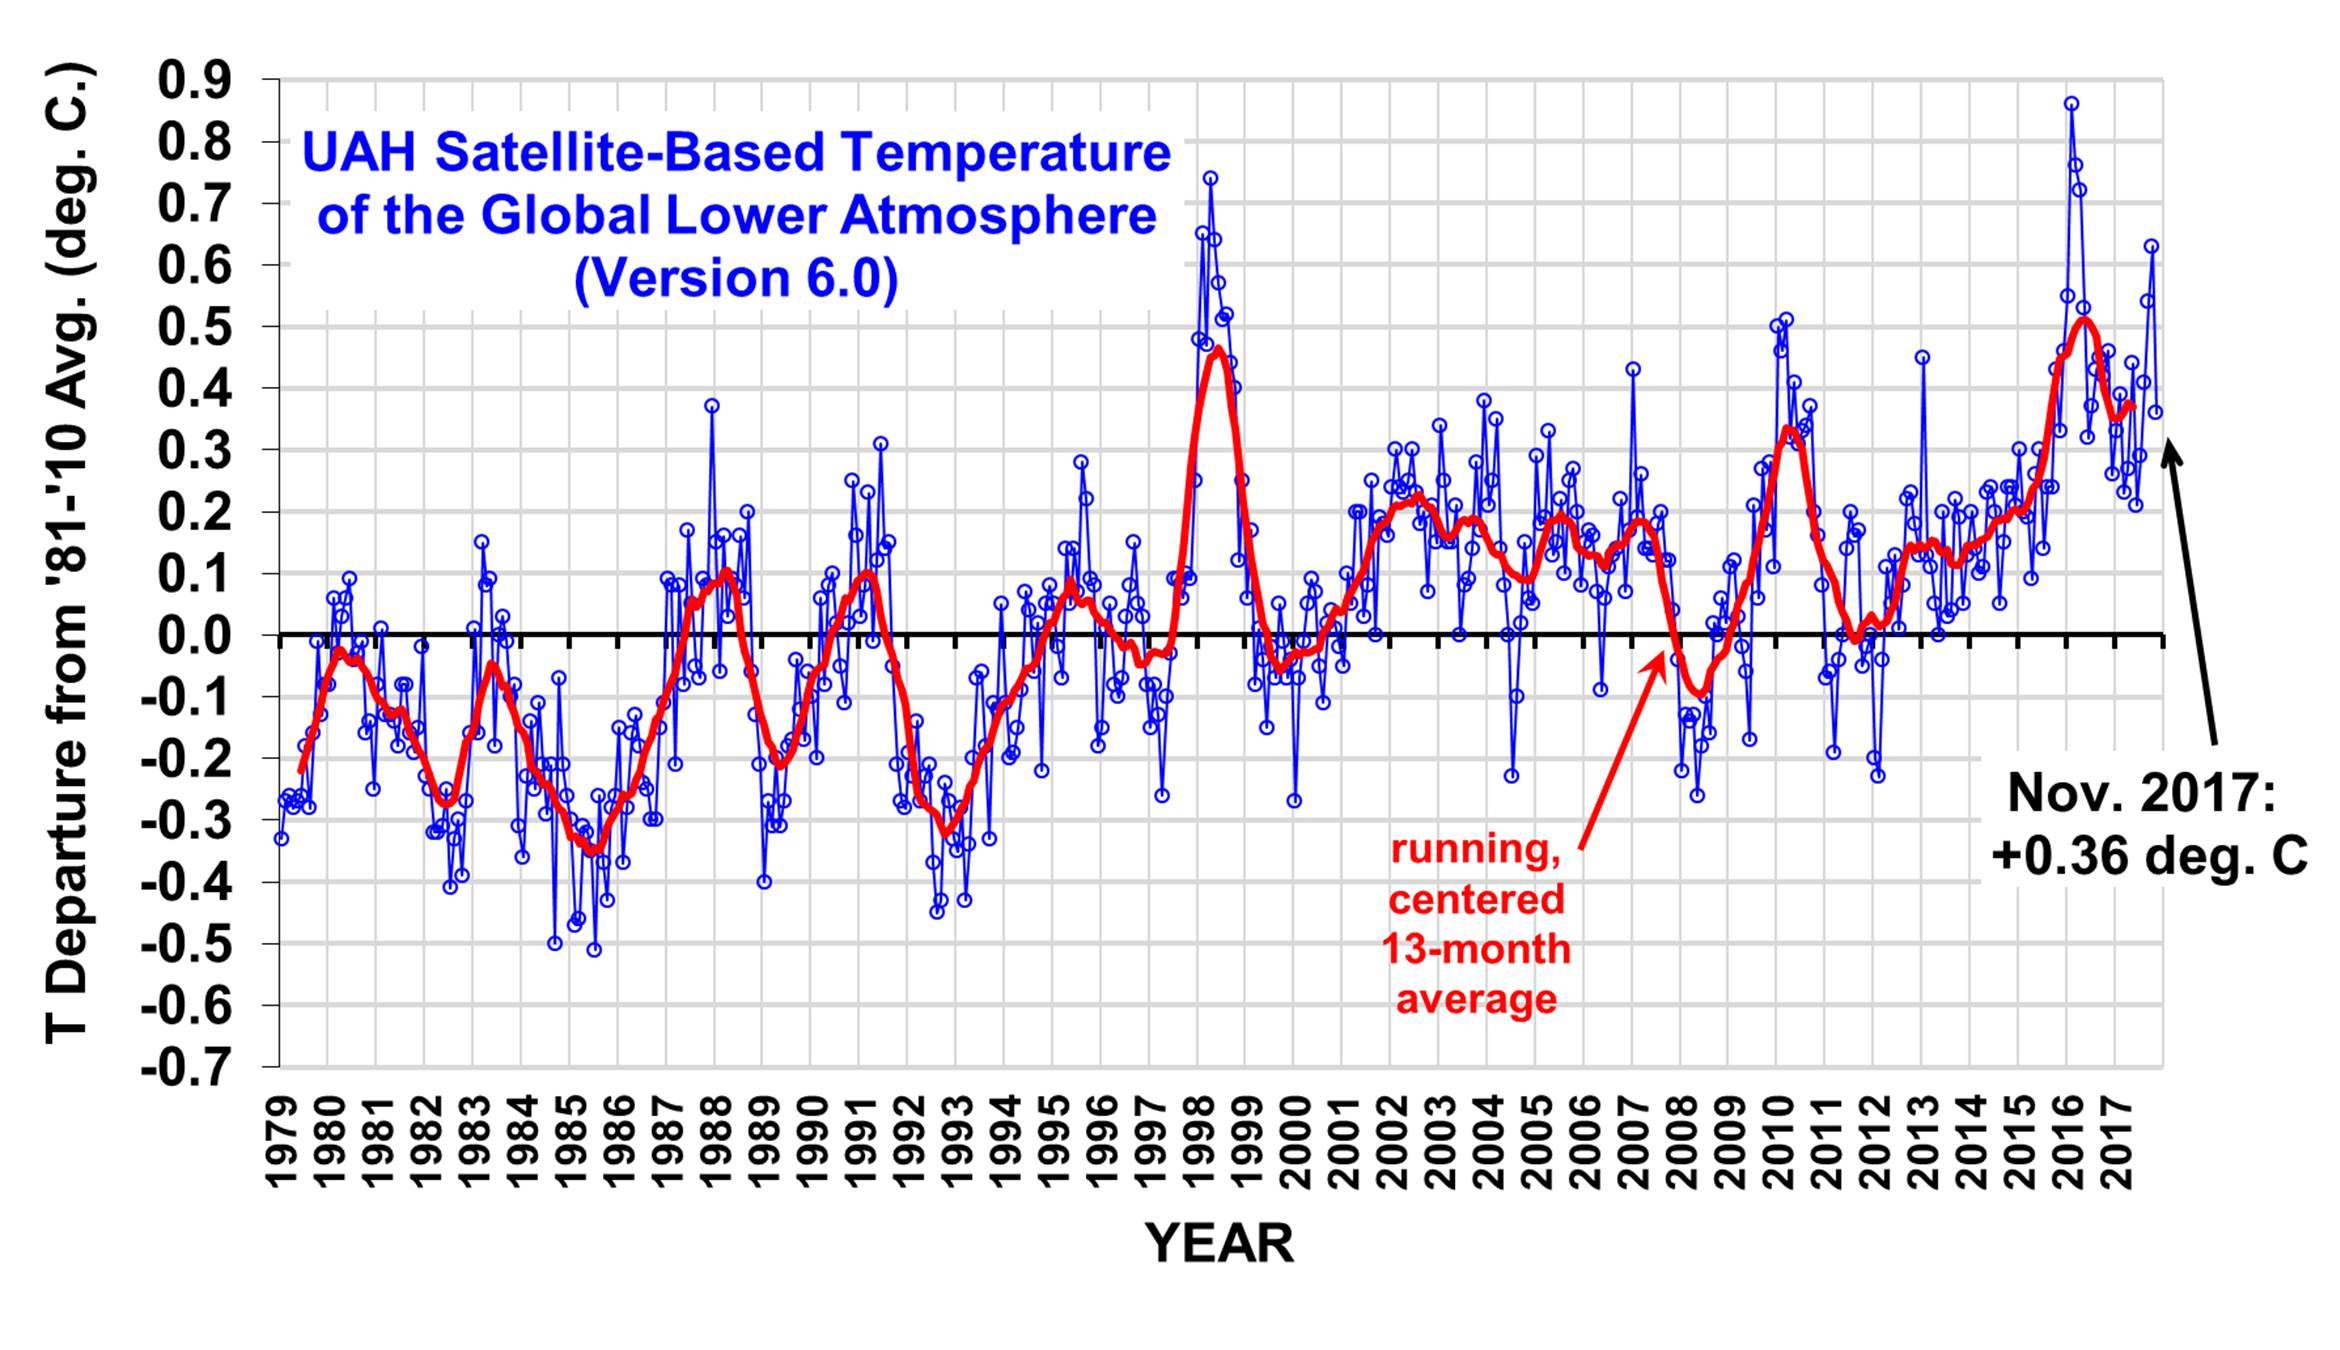
Apparently we didn't know how to read a thermometer in any of the decades of the last century. They all had to be 'adjusted'.
Then we found out that we didn't know how to read thermometers in the 00's. And everything had to be 'readjusted'.
In three years we will find out that we didn't know how to read a thermometer in the 10's either. And all the readings will have to be re-readjusted.
In actual fact, the numbers are being constantly changed. The readings for pre-1960 typically go down, and after 1960 they typically go up.
The abrupt change at 1940 is the result of two things. Necessary but still discretionary adjustments to ocean temperatures. And a need to smooth out warming/cooling bump that wrecked the temperature to CO2 correlation.
Here is part of an email chain released in Climategate-
From: Tom Wigley <wigley@ucar.edu>
To: Phil Jones <p.jones@uea.ac.uk>
Subject: 1940s
Date: Sun, 27 Sep 2009 23:25:38 -0600
Cc: Ben Santer <santer1@llnl.gov>
It would be good to remove at least part of the 1940s blip, but we are still left with "why the blip"
Edit- remember these are just changes from 2008. No one knew that the adjustments were going to be made and the old data tossed out, or at least made unavailable. All the most reasonable and necessary adjustments had already been made by the turn of the millennium.
Yup reading that PDF on how they tried to explain the ice age of the 1970s was a myth the more I get file gate the more I get they really did change the temperature records.
Yup. It is the way they manufactured adjustments that changed the SHAPE of the temperature record. Adding or subtracting half a degree across the whole range doesn't make much of a difference. Cooling the start and warming the end makes a big difference in the trend.
Knocking the tops off hills and valleys makes the whole record look like a steady climb, rather than a series of cycles with an upwards trend. This is what homogenization does, although the massive corrections around the 40's were specifically targeted.
I used to be cynical...but after reading this PDF I totally see what they did...and they say Trump is a Barnum Bailey con artist this is pure B.S.
This is worth repeating
THE GLOBAL TEMPERATURE RECORDS:
A COOLING TREND. Efforts to accumulate and organize global temperature records began in
the 1870s (Somerville et al. 2007). The first analysis to show long-term warming trends was published
in 1938. However, such analyses were not updated very often. Indeed, the Earth appeared to have been
cooling for more than 2 decades when scientists first took note of the change in trend in the 1960s. The
seminal work was done by J. Murray Mitchell, who, in 1963, presented the first up-to-date temperature
reconstruction showing that a global cooling trend had begun in the 1940s. Mitchell used data from
nearly 200 weather stations, collected by the World Weather Records project under the auspices of the World Meteorological Organization, to calculate latitudinal average temperature. His analysis showed
that global temperatures had increased fairly steadily from the 1880s, the start of his record, until about 1940, before the start of a steady multidecade cooling (Mitchell 1963).By the early 1970s, when Mitchell updated his work
(Mitchell 1972), the notion of a global cooling trend was widely accepted, albeit poorly understood. The first satellite records showed increasing snow and ice cover across the Northern Hemisphere from the late
1960s to the early 1970s. This trend was capped by unusually severe winters in Asia and parts of North
America in 1972 and 1973 (Kukla andKukla 1974