Nope. You’re just using the wrong data. New housing sale prices isn’t the right data. For starters, home sale prices isn’t great because most people haven’t bought a home in the last few years. Second, they’re not all buying new homes. You need a broader measure.
Graph and download economic data for Consumer Price Index for All Urban Consumers: Housing in U.S. City Average (CPIHOSSL) from Jan 1967 to May 2026 about urban, consumer, CPI, housing, inflation, price index, indexes, price, and USA.
fred.stlouisfed.org
Index went from 270 in 330.
25% is a long way from 40%.
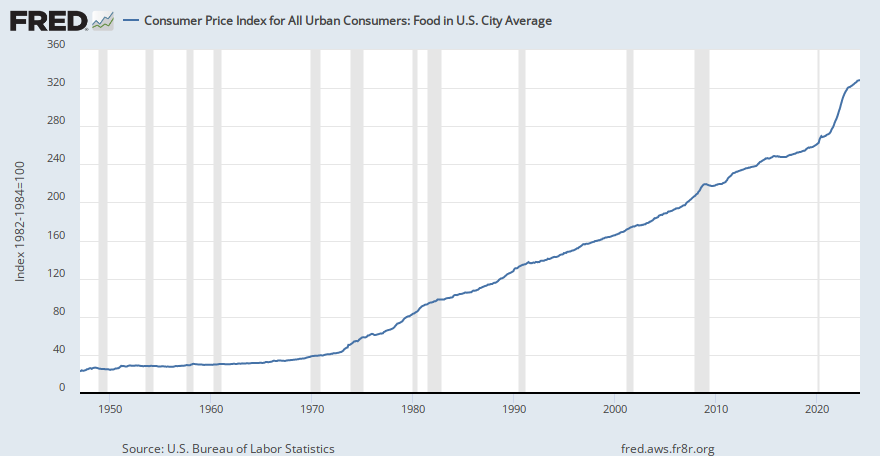
Graph and download economic data for Consumer Price Index for All Urban Consumers: Food in U.S. City Average (CPIUFDSL) from Jan 1947 to May 2026 about food, urban, consumer, CPI, inflation, price index, indexes, price, and USA.
fred.stlouisfed.org
From Jan 2021 to now, it went from 270 to 328. I got 21% increase.