The disturbing part is how these amounts of spending have changed over the years relative to GDP. Socialist entitlement programs have seen the biggest growth and thus added the most to the debt.
View attachment 176342
The two "socialist programs" that are driving the growth are called
Social Security and Medicare.
What do they do? They take care of our elderly and disabled people.
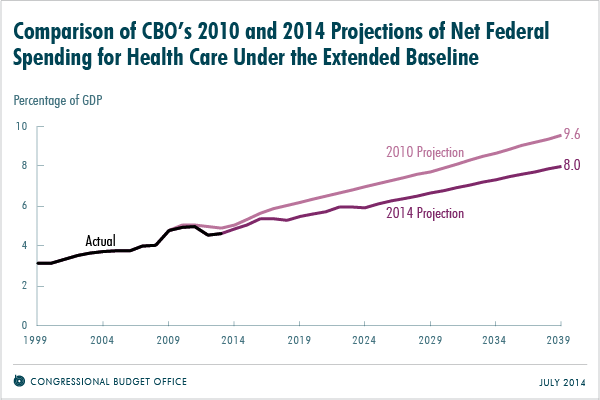
Why are they growing? Because our population is aging and their ever more advanced healthcare is getting more expensive.
"Disturbing" is not the fact that they are growing, that part was well predicted by simple demographics and healthcare cost projections (which are actually significantly down since ACA became law, no thanks to Republicans). Our populating is getting older, and we need to take care of our elderly, it's as simple as that.
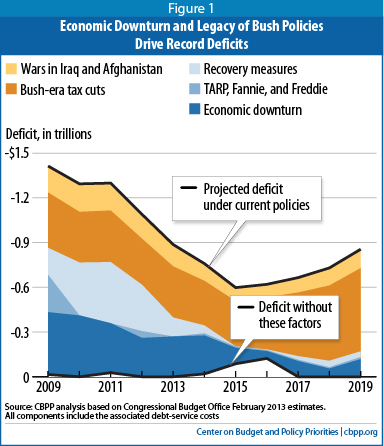
Disturbing part is how this country seems to be hooked on the tax-cuting crack at a time when
EXACTLY OPPOSITE is what our long term solvency needs.
We didn't need to blow 1.5Trillion on tax cuts, we needed to find a way to SAVE 1.5 Trillion so when next recession hits we have SOMETHING to fall back on without shooting the debt interest rates through the roof.
Ok, I’ll ignore that you entirely missed the point that socialist programs are growing at an unsustainable rate, and ask you where you think we can SAVE 1.5 trillion. Bear in mind, discretionary spending at 1.2 trillion is half as much as mandatory socialist spending.
Entitlement Spending — considered as government pensions, healthcare and welfare — started out at the beginning of the 20th century at 0.4 percent of Gross Domestic Product (GDP). As you can see from Chart 2.81, entitlement spending was negligible until the Great Depression of the 1930s.
Chart Key:
- Welfare spending
- Healthcare spending
- Pension spending
In response to the Great Depression President Roosevelt and the New Deal cranked up welfare spending to 1.5 percent of GDP by the mid 1930s and over 2.0 percent on the eve of World War II in 1940.
In 1950, entitlement spending had reached 3.3 percent of GDP, mostly welfare, but by 1960 entitlement spending had reached 5 percent of GDP as Social Security spending started to ramp up.
In 1965 Congress passed Medicare, Medicaid and the Great Society programs, and entitlement spending exploded, breaching 11 percent of GDP in 1976.
By the early 1980s, entitlement spending reached 13 percent of GDP and pensions spending stabilized at a little over five percent of GDP, with welfare spending stabilized at three to four percent of GDP. But healthcare spending sustained a steady rise, from three percent of GDP in 1980 to five percent of GDP in 2000.
Since 2000, entitlement spending has increased, peaking briefly at 18 percent of GDP in 2010, with pension spending at 6.4 percent of GDP, health care at 7.3 percent GDP and welfare spending at 4.5 percent of GDP in the aftermath of the Great Recession of 2007-09.
In the 2010s welfare spending has contracted but health care and pensions spending has increased. In 2015 pension spending is estimated at 7.14 percent GDP, health care spending is estimated at 7.85 percent GDP, and welfare spending is estimated at 2.51 percent GDP.