You have been repeatedly shown the radiation profile reaching a satellite from the atmosphere. Some bands radiate at the full power of surface temperature, showing they escape directly. The CO2 15 micron band radiates at a power that corresponds to about minus 60C, far up in height and considerably less than surface temperature.
Well, at least you are partly right. Those profiles have come up in conversation, but your belief in models is so strong, that even when you see the evidence that they are wrong, you are unable to accept the fact. As I have said before, it is pointless to go over this with you because you can't accept anything that doesn't jibe with your beliefs, but what the hell, someone may get something out of this even if you can't.
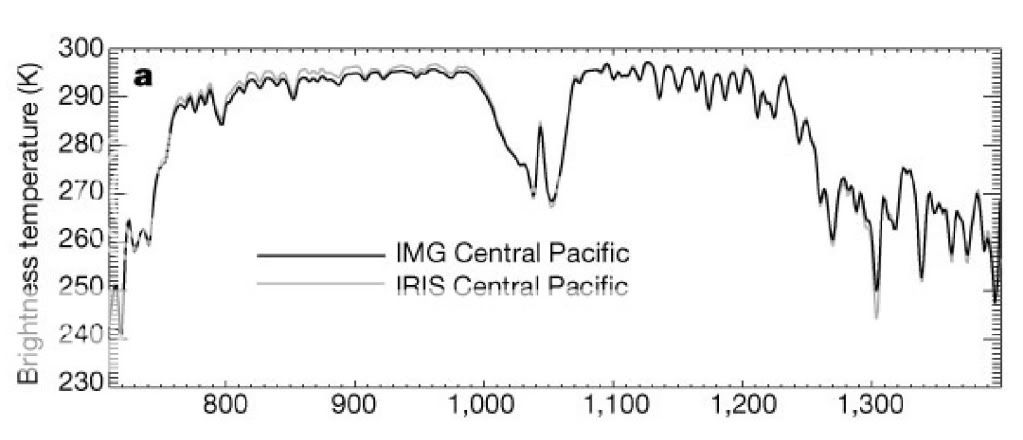
Here is an overlay of snapshots of outgoing long wave radiation taken in 1970 by the sattellite IRIS and in 1997 by the sattellite IMG in 1997. Both snapshots were taken over the central pacific at the same time of the year and under the same conditions.
If AGW theory were correct, and the physics that you so fervently believe in were correct, the IMG data from 1997 should show less outgoing longwave radiation in the CO2 wavelengths than the IRIS data from 1970 as there is certainly more CO2 in the atmosphere in 1997 than there was in 1970. As you can see, the longwave radiation from the two separate snapshots is identical indicating no additional absorption of outgoing longwave radiation in the CO2 wavelengths even though there is more CO2 in the atmosphere. What you believe simply isn't happening.
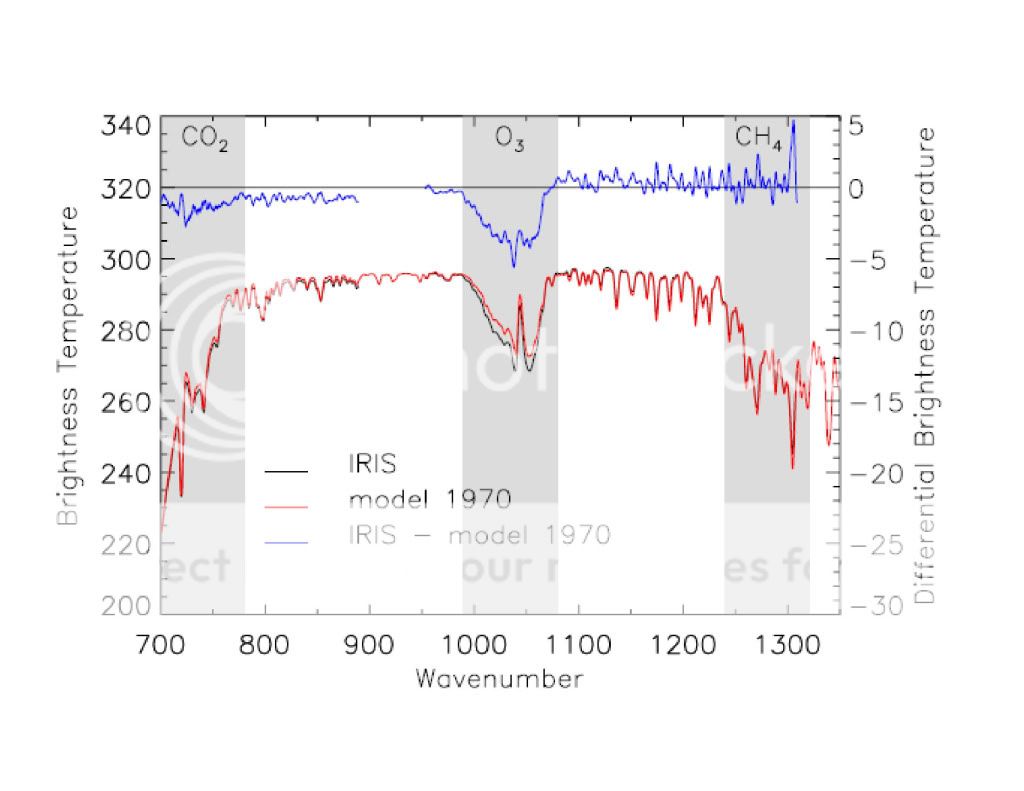
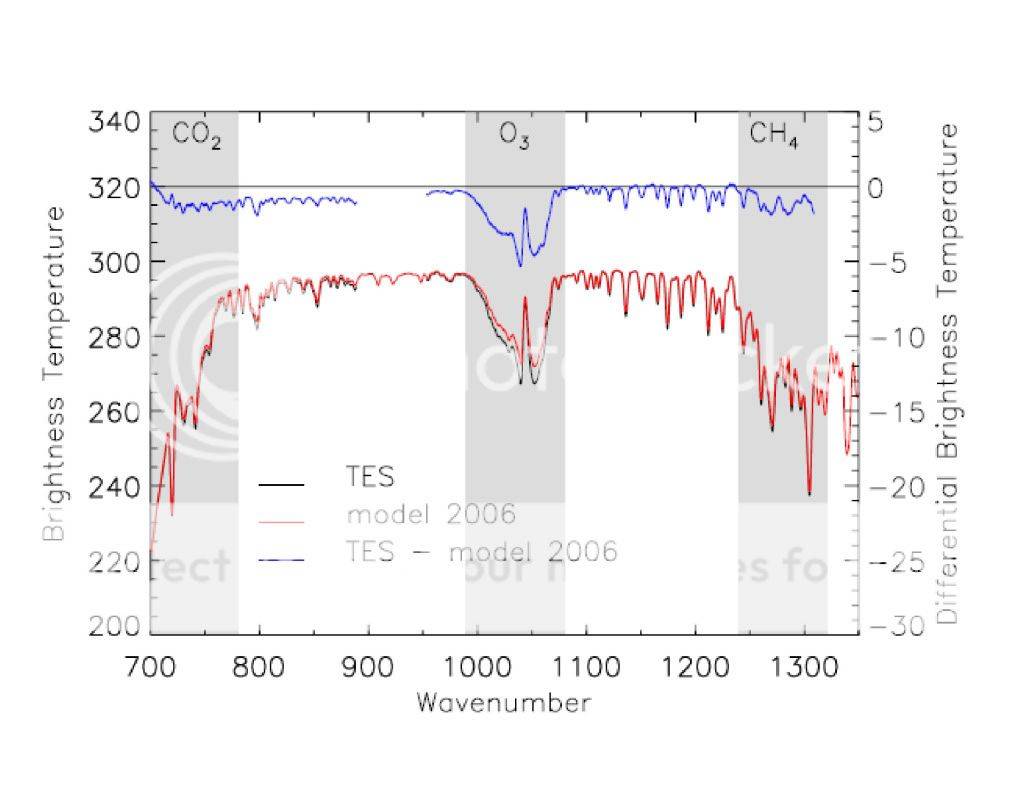
The next two images were taken by IRIS in 1970 and TES in 2006 respectively. In these graphs, the
black line represents the
actual measurement taken by the sattellite, the
red line represents
the prediction based on the physics you so fervently believe in and the
blue line represents the
difference between the model data and the actual data.
Now copy and print out the two graphs and overlay them. You will find that the black lines
(ACTUAL MEASURED DATA) are identical indicating this time, that there is
no difference between outgoing longwave radiation in the CO2 absorption spectrum between 1970 and 2006. Again, IF WHAT YOU BELIEVE IS HAPPENING WITH ENERGY IN THE ATMOSPHERE WERE ACTUALLY HAPPENING then the outgoing longwave radiation should be less in 2006 than it was in 1970....it isn't. As the blue lines (difference between actual observation, and the model prediction) on the graphs indicate. As you can see, this is not the case. There has been no increase in the absorption of outgoing longwave radiation in the CO2 spectrum between 1970 and 2006 in spite of the presence of more atmospheric CO2. The higher figures on the blue line indicate that the actual measurement is considerably higher than the model predicts.
The fact is that what you claim is happening simply is not happening because what you believe is happening is magic and as the graphs from 1970 to 2006 clearly indicate, there is no magic in the real world. There is no reduction of outgoing LW IR in the CO2 bands. There is some measured difference in the H2O bands but then water vapor can actually capture and hold on to IR whereas CO2 simply absorbs it and either loses it to a collision with another molecule or emits it on to cooler pastures.
You are wrong ian...your understanding of the physics is wrong and what you believe is happening in the atmosphere is demonstrably not happening.
I know you want to sidetrack over to water but we should clear up CO2 first. Do you agree that more 15 micron radiation goes in at the bottom than comes out at the top? If you disagree then what is your evidence?
CO2 is perfectly clear to anyone not so blinded by their belief in magic that they can't see it when it is posted right before their eyes. CO2 does nothing but absorb and then lose the energy to cooler areas of the atmosphere. That is all it does. It doesn't even slow the escape of IR to space by a nanosecond.
And as to what I "believe"...it doesn't matter..and more importantly, it doesn't matter what you believe either... The graphs above clearly show that all of the additional atmospheric CO2 increase between 1970 and 2006 has had exactly zero effect on the outgoing LW in the CO2 absorption bands. The models predicted a difference but none was measured. Chalk up yet another predictive failure for your hypothesis.
Once again Ian, in real science, how many predictive failures does a hypothesis get before it is scrapped and work begins on a hypothesis that more closely resembles the real observable world?