Complete US Voter Registration statistics, End of 2013

I know we talked about this yesterday, but the key variable for many elections (particularly Presidential) seems to be voter turnout. All the controversy about polling data in the last election cycle was really centered around the degree of bias each polling entity put into their data. To be fair, most got it right.

Stat, your data is interesting, but it really doesn't address the key motivational factor. Which bloc of voters is the most motivated to turn out? I am not sure how polling agencies determine this variable. I would be interested to know. Maybe they go off of voter registration data?


When roughly only 50%-60% of the electorate votes in most elections, the variable of turnout really does become critical.

So assume Democrat leaning voters are 46% of a States electorate, but their turnout is 60%, while Republican leaning voters are 54% of the electorate but turnout at only 50%. Guess what? The Democrat candidate wins. That is how important turnout becomes.


I would love to now how voters will turn out in 2014 and 2016. Will Obama's minority voting bloc continue to turn out in record numbers? In 2008 it was massive. It 2012 it was still very strong but fell off a bit. Will it continue to fall off in the next two election cycles, or will it remain strong? Personally, I have no clue. If anyone can speak to this issue I would be interested.

What a classy post! You have introduced an interesting aspect to he discussion. And, right there in the middle if it, you vomit up a phrase like "Obamas's minority voting block". Outstanding.


There was no judgment either way. It was a statement of fact. Minorities turned out in record numbers for Obama. To ignore that fact does a disservice to their voting power. Whites voted for Romney in the majority. I believe it was 54-46% split. Obama is President because minorities overwhelmingly voted for him. Again...it is not a judgment call on my part...it is a statement of fact. Facts should never injury anyone's sensibilities.
 
[


There was no judgment either way. It was a statement of fact. Minorities turned out in record numbers for Obama. To ignore that fact does a disservice to their voting power. Whites voted for Romney in the majority. I believe it was 54-46% split. Obama is President because minorities overwhelmingly voted for him. Again...it is not a judgment call on my part...it is a statement of fact. Facts should never injury anyone's sensibilities.

Again it's not the statement of facts, it is the fact you seem offended by them.

The GOP didn't get minority votes because they have spent the last 30 years finding ways to piss them off.

And here's the bigger problem you guys have. WHen Obama is off the stage, and the Democrats nominate a white person, you aren't going to have the racists animating your party like a shambling zombie.
 
I know we talked about this yesterday, but the key variable for many elections (particularly Presidential) seems to be voter turnout. All the controversy about polling data in the last election cycle was really centered around the degree of bias each polling entity put into their data. To be fair, most got it right.

Stat, your data is interesting, but it really doesn't address the key motivational factor. Which bloc of voters is the most motivated to turn out? I am not sure how polling agencies determine this variable. I would be interested to know. Maybe they go off of voter registration data?


When roughly only 50%-60% of the electorate votes in most elections, the variable of turnout really does become critical.

So assume Democrat leaning voters are 46% of a States electorate, but their turnout is 60%, while Republican leaning voters are 54% of the electorate but turnout at only 50%. Guess what? The Democrat candidate wins. That is how important turnout becomes.


I would love to now how voters will turn out in 2014 and 2016. Will Obama's minority voting bloc continue to turn out in record numbers? In 2008 it was massive. It 2012 it was still very strong but fell off a bit. Will it continue to fall off in the next two election cycles, or will it remain strong? Personally, I have no clue. If anyone can speak to this issue I would be interested.

The bolded: absolutely impossible to gauge, for one simple reason. Not enough pollsters poll intensity and then do a breakdown by partisan breakdown. Plus, the last minute undecideds, which can be up to 8% of the electorate, but are usually more like 3%, never give data on that.

The second bolded: also correct, which is why GOTV is all the more important. And also why VR stat changes can tell us a lot. The GOP has made a lot of noise about Pennsylvania. In 2004, Bush visited the state almost 60 times, and as a sitting incumbent in a time of war, he was unable to flip this state. John McCain made a SERIOUS play for Pennsylvania (which I called a "Hail Mary" back then and got flamed, but we now know that even McCain himself called Pennsylvania exactly this) and lost by 10.31%. Romney made an even more serious play for PA, seeing very clearly that he was never ahead in Ohio, not even once, and still lost PA by 5.37%. As Jon King indicated on CNN, the political "DNA" of Pennsylvania simply runs very deep blue. And the VR stats still show a healthy double digit D edge in the state, just like before the 2012 election. Which means that PA is likely to be just as "battlegroundy" as ever in 2014, but the advantage is clearly D.


Traditionally, at the presidential level and also at the Gubernatorial, the candidate gets between 85-90% of his party's vote and the two from the two major parties tend to offset each other. It is only in incredibly lopsided years like Nixon 1972, Reagan 1984 that this pattern does not hold. which is why the I's generally decide elections in our Union.

So, the statistic that you think would be helpful doesn't really exist.

Honestly, what I am putting out there is the best that is available right now and that is simply Voter Registration stats from the 50 states +DC, where available. That, VT and the actual results are the only rubriks where we can attain complete data. What other people are looking for is either so incomplete that it would be terribly skewed, or it doesn't exist at all.

The extreme right has been claiming that conservatives have not been turning out in the last 2 presidential elections. The 85-90% figure indicates that the conservatives are the ones most motivated to vote and any drop off would have occurred on the moderate side of the GOP as being less enthralled with the ticket so therefore less motivated to vote. That is confirmed by the Dems gaining the majority of the Independent vote on both occasions.


Romney got fewer than a million more votes than McCain. I am not sure how anyone can say "moderate republicans" voted less than "conservative republicans." I do not think that data exists, and if so, how would you measure it?

I have also not seen how self-identified independent voters actually voted in the last election cycle. You claim independents voted more heavily for Obama. You may be right, but I would love to see the data.

What we do know is whites regardless of party affiliation voted in high numbers in the last election cycle. The majority went for Romney....men overwhelmingly. Black voter turnout was at an historic high...quite a bit higher than whites. Without this minority voting bloc Obama is not President. Again....that is a statement of fact. It should not offend anyone.

I think the key two variables in the 2014 and 2016 will be overall turnout and voter motivation by party affiliation. I have no idea how this will turn out. I can speculate, but that is all it would be...speculation.

The other key variable is how minorities will turn out without a black man at the top of the ticket. If they turn out like they did in 2008 and 2012 then I think the Democrats look to be in good shape. If minority voting patterns return to historic norms then I think Republicans are okay, depending on how they do in key battleground States. That is how I see it. Turnout....voter motivation by party affiliation...and how Obama's minority coalition turns out.
 
[


There was no judgment either way. It was a statement of fact. Minorities turned out in record numbers for Obama. To ignore that fact does a disservice to their voting power. Whites voted for Romney in the majority. I believe it was 54-46% split. Obama is President because minorities overwhelmingly voted for him. Again...it is not a judgment call on my part...it is a statement of fact. Facts should never injury anyone's sensibilities.

Again it's not the statement of facts, it is the fact you seem offended by them.

The GOP didn't get minority votes because they have spent the last 30 years finding ways to piss them off.

And here's the bigger problem you guys have. WHen Obama is off the stage, and the Democrats nominate a white person, you aren't going to have the racists animating your party like a shambling zombie.


Joey, dial it down dude. Chill. I am not offended in the slightest. People can vote however they want based on whatever criteria they want. Okay? Second, I don't care why minority voters voted the way they did. You can speculate on that all day long (as you did above).

For the sake of this thread I choose not to speculate. The facts are the facts. Now seriously...take a deep breath and throttle it down. No one attacking you personally or any of your sacred cows. Learn to relax a little. :)
 
One last idea that highlights the importance of turnout. An analysis was done of the 2012 Presidential election. Had voter turnout been identical to 2004 Romney would be President.

Think about that for a moment.

That is how historic minority turnout was in 2008 and 2012. Again, if the Democrats get similar minority turnout in the next two election cycles they are in good shape. If not...all bets are off. I don't think anyone can reasonably say at this point how it will all turn out. Attached is an analysis of the 2012 election. It flatly states in the headline exactly what I have been saying. "Minority Turnout Determined the Election." Here is the link.


Minority Turnout Determined the 2012 Election | Brookings Institution

YOu can try painting it anyway you want. (YOu'd really have more credibility in the "I'm not a racist!" game if you didn't have a racist screen name).

The thing is, the white vote has steadily shrunk as a percentage of the electorate by about 2% per election cycle.

That's not going to change.

If the GOP wants to survive in the long run, it needs to give minorities a reason to vote for them, stop alienating women, and stop helping the rich screw over working folks.

And getting rid of the crazy would probably be a big help.
 
[


There was no judgment either way. It was a statement of fact. Minorities turned out in record numbers for Obama. To ignore that fact does a disservice to their voting power. Whites voted for Romney in the majority. I believe it was 54-46% split. Obama is President because minorities overwhelmingly voted for him. Again...it is not a judgment call on my part...it is a statement of fact. Facts should never injury anyone's sensibilities.

Again it's not the statement of facts, it is the fact you seem offended by them.

The GOP didn't get minority votes because they have spent the last 30 years finding ways to piss them off.

And here's the bigger problem you guys have. WHen Obama is off the stage, and the Democrats nominate a white person, you aren't going to have the racists animating your party like a shambling zombie.


Joey, dial it down dude. Chill. I am not offended in the slightest. People can vote however they want based on whatever criteria they want. Okay? Second, I don't care why minority voters voted the way they did. You can speculate on that all day long (as you did above).

For the sake of this thread I choose not to speculate. The facts are the facts. Now seriously...take a deep breath and throttle it down. No one attacking you personally or any of your sacred cows. Learn to relax a little. :)

I am perfectly relaxed.

I also know when I am dealing with a troll.

Here's the real problem you guys had in 2012.

You had a perfectly good argument for change. 7.8% unemployment, $4.00/gallon gasoline, trillion dollar deficits...

And what did you talk about?

Birth Certificates.
Self-Deportation.
"I like to fire people".
"47% of you are moochers!"
 
Joe,

The only one trolling here is you. I think Stat's intent in this thread and basically present factual information and be non-partisan. The only person I have seen be overtly partisan is you. I will not engage in that. Period. This is the main point I posted. I will repeat it. It is as objective as I can make it.

"I think the key two variables in the 2014 and 2016 will be overall turnout and voter motivation by party affiliation. I have no idea how this will turn out. If minority voting patterns return to historic norms then I think Republicans are okay, depending on how they do in key battleground States. That is how I see it. Turnout....voter motivation by party affiliation...and how Obama's minority coalition turns out."
 
Last edited:
Joe,

The only one trolling here is you. I think Stat's intent in this thread and basically present factual information and be non-partisan. The only person I have seen be overtly partisan is you. I will not engage in that. Period. This is the main point I posted. I will repeat it. It is as objective as I can make it.

"I think the key two variables in the 2014 and 2016 will be overall turnout and voter motivation by party affiliation. I have no idea how this will turn out. If minority voting patterns return to historic norms then I think Republicans are okay, depending on how they do in key battleground States. That is how I see it. Turnout....voter motivation by party affiliation...and how Obama's minority coalition turns out."

Right. It's all them minorities that put Obama in office. And them whores.

Seriously, do you rednecks even hear yourselves half the time.


Merry Christmas, Joe. I'm done. Read this and let us know what you think. Happy holidays one and all. :)

Minority Turnout Determined the 2012 Election | Brookings Institution
 
I know we talked about this yesterday, but the key variable for many elections (particularly Presidential) seems to be voter turnout. All the controversy about polling data in the last election cycle was really centered around the degree of bias each polling entity put into their data. To be fair, most got it right.

Stat, your data is interesting, but it really doesn't address the key motivational factor. Which bloc of voters is the most motivated to turn out? I am not sure how polling agencies determine this variable. I would be interested to know. Maybe they go off of voter registration data?


When roughly only 50%-60% of the electorate votes in most elections, the variable of turnout really does become critical.

So assume Democrat leaning voters are 46% of a States electorate, but their turnout is 60%, while Republican leaning voters are 54% of the electorate but turnout at only 50%. Guess what? The Democrat candidate wins. That is how important turnout becomes.


I would love to now how voters will turn out in 2014 and 2016. Will Obama's minority voting bloc continue to turn out in record numbers? In 2008 it was massive. It 2012 it was still very strong but fell off a bit. Will it continue to fall off in the next two election cycles, or will it remain strong? Personally, I have no clue. If anyone can speak to this issue I would be interested.

The bolded: absolutely impossible to gauge, for one simple reason. Not enough pollsters poll intensity and then do a breakdown by partisan breakdown. Plus, the last minute undecideds, which can be up to 8% of the electorate, but are usually more like 3%, never give data on that.

The second bolded: also correct, which is why GOTV is all the more important. And also why VR stat changes can tell us a lot. The GOP has made a lot of noise about Pennsylvania. In 2004, Bush visited the state almost 60 times, and as a sitting incumbent in a time of war, he was unable to flip this state. John McCain made a SERIOUS play for Pennsylvania (which I called a "Hail Mary" back then and got flamed, but we now know that even McCain himself called Pennsylvania exactly this) and lost by 10.31%. Romney made an even more serious play for PA, seeing very clearly that he was never ahead in Ohio, not even once, and still lost PA by 5.37%. As Jon King indicated on CNN, the political "DNA" of Pennsylvania simply runs very deep blue. And the VR stats still show a healthy double digit D edge in the state, just like before the 2012 election. Which means that PA is likely to be just as "battlegroundy" as ever in 2014, but the advantage is clearly D.


Traditionally, at the presidential level and also at the Gubernatorial, the candidate gets between 85-90% of his party's vote and the two from the two major parties tend to offset each other. It is only in incredibly lopsided years like Nixon 1972, Reagan 1984 that this pattern does not hold. which is why the I's generally decide elections in our Union.

So, the statistic that you think would be helpful doesn't really exist.

Honestly, what I am putting out there is the best that is available right now and that is simply Voter Registration stats from the 50 states +DC, where available. That, VT and the actual results are the only rubriks where we can attain complete data. What other people are looking for is either so incomplete that it would be terribly skewed, or it doesn't exist at all.

The extreme right has been claiming that conservatives have not been turning out in the last 2 presidential elections. The 85-90% figure indicates that the conservatives are the ones most motivated to vote and any drop off would have occurred on the moderate side of the GOP as being less enthralled with the ticket so therefore less motivated to vote. That is confirmed by the Dems gaining the majority of the Independent vote on both occasions.


Be careful of the 85-90% figure I quoted. I mean the percentage of those from a party who actually came out to vote. It is not a reflection of voter turnout in terms of percentage of all from that state who are registered for that party.

Also, a note:

Out of fairness, and people should be noticing by now that when it comes to numbers, I love the numbers but am also impassionate about which side they represent, please remember that we just jumped from 105.4 million people voting in 2000 to 122.3 million voting in 2004 (the largest raw vote jump ever from one cycle to the next and one of the highest growth rates - percentually -, a jump of 16.87 million people in just one cycle) to 131.4 million voting in 2008, back just slightly to 129.2 million voting in 2012. That is a jump of 23.8 MILLION voters in 12 years, or three cycles from the start cycle.

To put that in perspective: the difference in total votes cast between 1976 and 2000 is also 23.8 million. So, what took 24 years to achieve in the last century in terms of voter growth, we just did in 12 years, 1/2 the time!

Source:

http://uselectionatlas.org/RESULTS/compare.php?type=national&year=2012&f=1&off=0&elect=0

With such an enormous jump in voter involvement, it is really impossible to know which voters from which groups "stayed home", so to speak.

And for those who say that Republican voter enthusiasm was somehow down in 2012, I will remind that Mitt Romney scored the 2nd highest number of votes that a Republicans has EVER scored for President, and just over 1,000,000 less votes than the number one guy for the GOP in terms of total votes received: George W. Bush, Jr.


It's not that millions and millions of secretly hidden Republican voters stayed home. That is not true. Romney scored crushing margins in the Breadbasket, in most of the South, in the Big Sky states - but not the same margins as Bush from 2004. Nonetheless, they were crushing. It is more likely that the intensity on boths sides was pretty much identical, there were just more Democratic voters, basta.

It's also that the partisan breakdown of the end polls from 2012 ended up being -on the whole - quite accurate. Polls for months on end were constantly showing self-identified partisan identification between D+6 and D+8 and on election night, it was D+7.
 
Maybe I'm wrong but I am certain the various districts report how many registered voters from each party affiliation actually turned out to vote.

Of course who and what they voted for is secret and cannot possibly be reported.

I keep seeing reports such as - "?% of registered Democrats turned out to vote."

So, why would that information NOT be available?


I have never seen that before. Ever.

But if you come across a link, feel free to pass it along to me and I will gladly research it. You have possibilities in 30 states plus DC. the other 20 states do not do VR by party identification at all.

But already, I see a problem with that: unless every district in a state does this, the statistic still doesn't help anyone.

where are you seeing those reports?

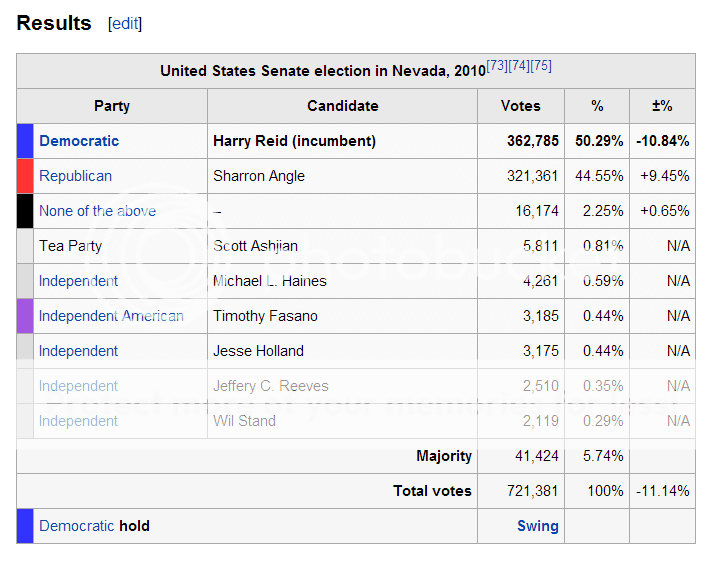
Go to United States Senate election in Nevada, 2010 - Wikipedia, the free encyclopedia and way down at the bottom is a graphic that shows how many votes the candidates received by political party. Shouldn't that be available for other races?


This is the graphic you linked me to:

Nevada2010_zpsc5d4fec9.png


Longknife, that graphic was the TOTAL vote, not the breakdown by party! Reid won in the entire state among ALL votes with 50.29%, it doesn't mean that he only won 50.29% of registered Democrats who went to vote that day! The D stands in the column to the left of Reid's name because that is the party he is affiliated with and it is common policy to list the political party next to a candidates's name. That is NOT a breakdown by party. Otherwise, we should have seen an (R) and an (I) column for Reid as well, and a (D) and an (I) column for Angle as well!

I believe you misread the chart!

Or are you saying you want to see the final results? Here are all of them, in great details, from 2012:

Statistikhengst's ELECTORAL POLITICS - 2013 and beyond: GE 2012 - End Analysis
 
The bolded: absolutely impossible to gauge, for one simple reason. Not enough pollsters poll intensity and then do a breakdown by partisan breakdown. Plus, the last minute undecideds, which can be up to 8% of the electorate, but are usually more like 3%, never give data on that.

The second bolded: also correct, which is why GOTV is all the more important. And also why VR stat changes can tell us a lot. The GOP has made a lot of noise about Pennsylvania. In 2004, Bush visited the state almost 60 times, and as a sitting incumbent in a time of war, he was unable to flip this state. John McCain made a SERIOUS play for Pennsylvania (which I called a "Hail Mary" back then and got flamed, but we now know that even McCain himself called Pennsylvania exactly this) and lost by 10.31%. Romney made an even more serious play for PA, seeing very clearly that he was never ahead in Ohio, not even once, and still lost PA by 5.37%. As Jon King indicated on CNN, the political "DNA" of Pennsylvania simply runs very deep blue. And the VR stats still show a healthy double digit D edge in the state, just like before the 2012 election. Which means that PA is likely to be just as "battlegroundy" as ever in 2014, but the advantage is clearly D.


Traditionally, at the presidential level and also at the Gubernatorial, the candidate gets between 85-90% of his party's vote and the two from the two major parties tend to offset each other. It is only in incredibly lopsided years like Nixon 1972, Reagan 1984 that this pattern does not hold. which is why the I's generally decide elections in our Union.

So, the statistic that you think would be helpful doesn't really exist.

Honestly, what I am putting out there is the best that is available right now and that is simply Voter Registration stats from the 50 states +DC, where available. That, VT and the actual results are the only rubriks where we can attain complete data. What other people are looking for is either so incomplete that it would be terribly skewed, or it doesn't exist at all.

The extreme right has been claiming that conservatives have not been turning out in the last 2 presidential elections. The 85-90% figure indicates that the conservatives are the ones most motivated to vote and any drop off would have occurred on the moderate side of the GOP as being less enthralled with the ticket so therefore less motivated to vote. That is confirmed by the Dems gaining the majority of the Independent vote on both occasions.


Be careful of the 85-90% figure I quoted. I mean the percentage of those from a party who actually came out to vote. It is not a reflection of voter turnout in terms of percentage of all from that state who are registered for that party.

Also, a note:

Out of fairness, and people should be noticing by now that when it comes to numbers, I love the numbers but am also impassionate about which side they represent, please remember that we just jumped from 105.4 million people voting in 2000 to 122.3 million voting in 2004 (the largest raw vote jump ever from one cycle to the next and one of the highest growth rates - percentually -, a jump of 16.87 million people in just one cycle) to 131.4 million voting in 2008, back just slightly to 129.2 million voting in 2012. That is a jump of 23.8 MILLION voters in 12 years, or three cycles from the start cycle.

To put that in perspective: the difference in total votes cast between 1976 and 2000 is also 23.8 million. So, what took 24 years to achieve in the last century in terms of voter growth, we just did in 12 years, 1/2 the time!

Source:

http://uselectionatlas.org/RESULTS/compare.php?type=national&year=2012&f=1&off=0&elect=0

With such an enormous jump in voter involvement, it is really impossible to know which voters from which groups "stayed home", so to speak.

And for those who say that Republican voter enthusiasm was somehow down in 2012, I will remind that Mitt Romney scored the 2nd highest number of votes that a Republicans has EVER scored for President, and just over 1,000,000 less votes than the number one guy for the GOP in terms of total votes received: George W. Bush, Jr.


It's not that millions and millions of secretly hidden Republican voters stayed home. That is not true. Romney scored crushing margins in the Breadbasket, in most of the South, in the Big Sky states - but not the same margins as Bush from 2004. Nonetheless, they were crushing. It is more likely that the intensity on boths sides was pretty much identical, there were just more Democratic voters, basta.

It's also that the partisan breakdown of the end polls from 2012 ended up being -on the whole - quite accurate. Polls for months on end were constantly showing self-identified partisan identification between D+6 and D+8 and on election night, it was D+7.


Great analysis and absolutely factual in my opinion. The meme that Republican voters stayed away from the polls is false. They voted heavily. Asian and Hispanic voter tallies were down slightly from 2008, but they still voted in big numbers. Black voter turnout was the highest of any group. Overall, the minority vote put Obama over the top. There is no question of that.

You raise an excellent point about increase in the voter rolls since 2004. My guess is the expansion has largely been in minority voting ranks which obviously benefits the Dems. The article I posted said Republicans will need to pry away some of these voters in the next two election cycles. That appears to be happening among Hispanic voters according to recent polling. Will it be enough? I don't know. And again, I don't think anyone clearly knows true voter intensity by party affiliation. All of those variables will be critical.
 
One last idea that highlights the importance of turnout. An analysis was done of the 2012 Presidential election. Had voter turnout been identical to 2004 Romney would be President.

Think about that for a moment.

That is how historic minority turnout was in 2008 and 2012. Again, if the Democrats get similar minority turnout in the next two election cycles they are in good shape. If not...all bets are off. I don't think anyone can reasonably say at this point how it will all turn out. Attached is an analysis of the 2012 election. It flatly states in the headline exactly what I have been saying. "Minority Turnout Determined the Election." Here is the link.


Minority Turnout Determined the 2012 Election | Brookings Institution


Wrong.

There is only a 2 point difference in VT between 2012 and 2004, regardless whether you are talking about comparison to the actual number of registered voters or VAP.

That would not have done it for Romney.

What you are trying to say, if I am correct, is that had the white vote component from 2012 (72%) been the same percentage of the total electorate as in 2004 (77%), then Romney would have won, and that is likely correct.

But the electorate is always changing. Doing a "what, if, were, then, now" scenario after the fact helps little. The GOP knew that this demographic problem was coming at it for a long time.

It is more than likely that the white vote will sink to 71% or 70% in 2016, if historical precedent over many presidential cycles is our guide. Relying on a mammoth white vote to win national elections is no longer an option for the GOP.


Wrong.


You obvious didn't read the link I posted. The supposition I posted was not my analysis. Here is exactly what was said.


With 2004 Turnout Levels: Republicans win in 2012 but not 2016

To assess the impact of turnout alone on the 2012 election I assumed that the national electorate had the size and racial and ethnic composition of the new Census survey and applied to it the more “Republican favorable” turnout rates of 2004 for each racial and ethnic group, as shown in Figure 2. This of course resulted in more white voters and fewer minority voters than actually occurred in 2012. To these voter populations, I applied the actual 2012 voting margins as shown in Figure 3. The result of this exercise was a small 2012 Romney win of 9,000 votes—a virtual tossup. Thus it might be said that the high minority and low white turnout rates of 2012 were responsible for Obama taking the national vote, irrespective of the changing demography of the electorate.


Your second point is wrong as well. I already acknowledged the GOP cannot rely on old demographics and will need to pry away more minority voters. Please read more carefully. Thanks.
 
The extreme right has been claiming that conservatives have not been turning out in the last 2 presidential elections. The 85-90% figure indicates that the conservatives are the ones most motivated to vote and any drop off would have occurred on the moderate side of the GOP as being less enthralled with the ticket so therefore less motivated to vote. That is confirmed by the Dems gaining the majority of the Independent vote on both occasions.


Be careful of the 85-90% figure I quoted. I mean the percentage of those from a party who actually came out to vote. It is not a reflection of voter turnout in terms of percentage of all from that state who are registered for that party.

Also, a note:

Out of fairness, and people should be noticing by now that when it comes to numbers, I love the numbers but am also impassionate about which side they represent, please remember that we just jumped from 105.4 million people voting in 2000 to 122.3 million voting in 2004 (the largest raw vote jump ever from one cycle to the next and one of the highest growth rates - percentually -, a jump of 16.87 million people in just one cycle) to 131.4 million voting in 2008, back just slightly to 129.2 million voting in 2012. That is a jump of 23.8 MILLION voters in 12 years, or three cycles from the start cycle.

To put that in perspective: the difference in total votes cast between 1976 and 2000 is also 23.8 million. So, what took 24 years to achieve in the last century in terms of voter growth, we just did in 12 years, 1/2 the time!

Source:

http://uselectionatlas.org/RESULTS/compare.php?type=national&year=2012&f=1&off=0&elect=0

With such an enormous jump in voter involvement, it is really impossible to know which voters from which groups "stayed home", so to speak.

And for those who say that Republican voter enthusiasm was somehow down in 2012, I will remind that Mitt Romney scored the 2nd highest number of votes that a Republicans has EVER scored for President, and just over 1,000,000 less votes than the number one guy for the GOP in terms of total votes received: George W. Bush, Jr.


It's not that millions and millions of secretly hidden Republican voters stayed home. That is not true. Romney scored crushing margins in the Breadbasket, in most of the South, in the Big Sky states - but not the same margins as Bush from 2004. Nonetheless, they were crushing. It is more likely that the intensity on boths sides was pretty much identical, there were just more Democratic voters, basta.

It's also that the partisan breakdown of the end polls from 2012 ended up being -on the whole - quite accurate. Polls for months on end were constantly showing self-identified partisan identification between D+6 and D+8 and on election night, it was D+7.


Great analysis and absolutely factual in my opinion. The meme that Republican voters stayed away from the polls is false. They voted heavily. Asian and Hispanic voter tallies were down slightly from 2008, but they still voted in big numbers. Black voter turnout was the highest of any group. Overall, the minority vote put Obama over the top. There is no question of that.

You raise an excellent point about increase in the voter rolls since 2004. My guess is the expansion has largely been in minority voting ranks which obviously benefits the Dems. The article I posted said Republicans will need to pry away some of these voters in the next two election cycles. That appears to be happening among Hispanic voters according to recent polling. Will it be enough? I don't know. And again, I don't think anyone clearly knows true voter intensity by party affiliation. All of those variables will be critical.


Yes, I agree. But Obama's take of the white vote is actually higher than for a number of other Democrats in history. Of course, they lost in major landslides. If I recall correctly, you need to go back to 1964 to find a Democrat who won the White vote in a national election.

2004 also proved that a massive influx of new voters from one cycle to the next doesn't necessarily mean that it helps the Democrats. The lion's share of those new voters from 2000 to 2004 went for President Bush! And while my Democratic friends in 2004 kept saying that Kerry would win, I kept looking at the state polling and kept seeing too much weakness for Kerry where he should not be weak. I also predicted that Bush would win with 286 EV, but predicted +2.2% margin (he won with +2.46%).

However, in 2008, the lion's share of new voters, the influx from 2004 to 2008, were indeed for then-Senator Obama.

When you look at a presidential election, ignore the national numbers initially and look only at the battle on the ground in the 50 states. And above all else, look at the margins in Ohio - the oldest and most reliable belllwether of the nation, and now, Virginia - the new bellwether of the nation.

You are also correct that the asian and AI vote actually receded somewhat and I am 100% sure that 50% of this has to do with NYC and Hurricane Sandy and the other 50% has to do with California, where 500,000 less ballots were cast than in 2008, and predominantly from areas with considerable asian populations. But a slight negative growth rate doesn't mean much. It could be a statistical anomaly and we will have to wait and see how 2016 turns out.

2 things we know absolutely for sure:

-The White vote, in terms of percentage of the overall electorate on election day, continues to shrink. In fact, the white vote has been shrinking for a long, long time.

-The Latino and Black vote, in terms of percentage of the overall electorate on election day, both continue to grow, esp. the Latino vote.

In the most recent VA gubernatorial election, where McAuliffe won by +2.53%, black voter turnout was 20%, exactly identical to the statistic from the GE 2012, and black voters voted with the same intensity for McAuliffe as they did for Obama. So much for the meme that minorities are planning to sit at home in an off year. They came out, they exercised their right to vote. Basta.

Thanks for the kind words, btw.
 
One last idea that highlights the importance of turnout. An analysis was done of the 2012 Presidential election. Had voter turnout been identical to 2004 Romney would be President.

Think about that for a moment.

That is how historic minority turnout was in 2008 and 2012. Again, if the Democrats get similar minority turnout in the next two election cycles they are in good shape. If not...all bets are off. I don't think anyone can reasonably say at this point how it will all turn out. Attached is an analysis of the 2012 election. It flatly states in the headline exactly what I have been saying. "Minority Turnout Determined the Election." Here is the link.


Minority Turnout Determined the 2012 Election | Brookings Institution


Wrong.

There is only a 2 point difference in VT between 2012 and 2004, regardless whether you are talking about comparison to the actual number of registered voters or VAP.

That would not have done it for Romney.

What you are trying to say, if I am correct, is that had the white vote component from 2012 (72%) been the same percentage of the total electorate as in 2004 (77%), then Romney would have won, and that is likely correct.

But the electorate is always changing. Doing a "what, if, were, then, now" scenario after the fact helps little. The GOP knew that this demographic problem was coming at it for a long time.

It is more than likely that the white vote will sink to 71% or 70% in 2016, if historical precedent over many presidential cycles is our guide. Relying on a mammoth white vote to win national elections is no longer an option for the GOP.


Wrong.


You obvious didn't read the link I posted. The supposition I posted was not my analysis. Here is exactly what was said.


With 2004 Turnout Levels: Republicans win in 2012 but not 2016

To assess the impact of turnout alone on the 2012 election I assumed that the national electorate had the size and racial and ethnic composition of the new Census survey and applied to it the more “Republican favorable” turnout rates of 2004 for each racial and ethnic group, as shown in Figure 2. This of course resulted in more white voters and fewer minority voters than actually occurred in 2012. To these voter populations, I applied the actual 2012 voting margins as shown in Figure 3. The result of this exercise was a small 2012 Romney win of 9,000 votes—a virtual tossup. Thus it might be said that the high minority and low white turnout rates of 2012 were responsible for Obama taking the national vote, irrespective of the changing demography of the electorate.


Your second point is wrong as well. I already acknowledged the GOP cannot rely on old demographics and will need to pry away more minority voters. Please read more carefully. Thanks.


Wasn't trying to offend in any way. I read the link before I posted. I do think you did not mean VT as an overall statistic, but rather, the white component, which is actually what that article means (please see the red in the bolded above). So, I think we are squabbling over semantics. But a win of 9,000 votes nationally?? Horror, oh horror. Egads.... thank God that did not happen! Plus, 1876, 1884 and 2000 teach us that with such margins, an electoral backfire is very possible.

Imagine an election night where is it so close, that 35 states could not be called for 5 days or so.... igit...
 
Last edited:
Be careful of the 85-90% figure I quoted. I mean the percentage of those from a party who actually came out to vote. It is not a reflection of voter turnout in terms of percentage of all from that state who are registered for that party.

Also, a note:

Out of fairness, and people should be noticing by now that when it comes to numbers, I love the numbers but am also impassionate about which side they represent, please remember that we just jumped from 105.4 million people voting in 2000 to 122.3 million voting in 2004 (the largest raw vote jump ever from one cycle to the next and one of the highest growth rates - percentually -, a jump of 16.87 million people in just one cycle) to 131.4 million voting in 2008, back just slightly to 129.2 million voting in 2012. That is a jump of 23.8 MILLION voters in 12 years, or three cycles from the start cycle.

To put that in perspective: the difference in total votes cast between 1976 and 2000 is also 23.8 million. So, what took 24 years to achieve in the last century in terms of voter growth, we just did in 12 years, 1/2 the time!

Source:

http://uselectionatlas.org/RESULTS/compare.php?type=national&year=2012&f=1&off=0&elect=0

With such an enormous jump in voter involvement, it is really impossible to know which voters from which groups "stayed home", so to speak.

And for those who say that Republican voter enthusiasm was somehow down in 2012, I will remind that Mitt Romney scored the 2nd highest number of votes that a Republicans has EVER scored for President, and just over 1,000,000 less votes than the number one guy for the GOP in terms of total votes received: George W. Bush, Jr.


It's not that millions and millions of secretly hidden Republican voters stayed home. That is not true. Romney scored crushing margins in the Breadbasket, in most of the South, in the Big Sky states - but not the same margins as Bush from 2004. Nonetheless, they were crushing. It is more likely that the intensity on boths sides was pretty much identical, there were just more Democratic voters, basta.

It's also that the partisan breakdown of the end polls from 2012 ended up being -on the whole - quite accurate. Polls for months on end were constantly showing self-identified partisan identification between D+6 and D+8 and on election night, it was D+7.


Great analysis and absolutely factual in my opinion. The meme that Republican voters stayed away from the polls is false. They voted heavily. Asian and Hispanic voter tallies were down slightly from 2008, but they still voted in big numbers. Black voter turnout was the highest of any group. Overall, the minority vote put Obama over the top. There is no question of that.

You raise an excellent point about increase in the voter rolls since 2004. My guess is the expansion has largely been in minority voting ranks which obviously benefits the Dems. The article I posted said Republicans will need to pry away some of these voters in the next two election cycles. That appears to be happening among Hispanic voters according to recent polling. Will it be enough? I don't know. And again, I don't think anyone clearly knows true voter intensity by party affiliation. All of those variables will be critical.


Yes, I agree. But Obama's take of the white vote is actually higher than for a number of other Democrats in history. Of course, they lost in major landslides. If I recall correctly, you need to go back to 1964 to find a Democrat who won the White vote in a national election.

2004 also proved that a massive influx of new voters from one cycle to the next doesn't necessarily mean that it helps the Democrats. The lion's share of those new voters from 2000 to 2004 went for President Bush! And while my Democratic friends in 2004 kept saying that Kerry would win, I kept looking at the state polling and kept seeing too much weakness for Kerry where he should not be weak. I also predicted that Bush would win with 286 EV, but predicted +2.2% margin (he won with +2.46%).

However, in 2008, the lion's share of new voters, the influx from 2004 to 2008, were indeed for then-Senator Obama.

When you look at a presidential election, ignore the national numbers initially and look only at the battle on the ground in the 50 states. And above all else, look at the margins in Ohio - the oldest and most reliable belllwether of the nation, and now, Virginia - the new bellwether of the nation.

You are also correct that the asian and AI vote actually receded somewhat and I am 100% sure that 50% of this has to do with NYC and Hurricane Sandy and the other 50% has to do with California, where 500,000 less ballots were cast than in 2008, and predominantly from areas with considerable asian populations. But a slight negative growth rate doesn't mean much. It could be a statistical anomaly and we will have to wait and see how 2016 turns out.

2 things we know absolutely for sure:

-The White vote, in terms of percentage of the overall electorate on election day, continues to shrink. In fact, the white vote has been shrinking for a long, long time.

-The Latino and Black vote, in terms of percentage of the overall electorate on election day, both continue to grow, esp. the Latino vote.

In the most recent VA gubernatorial election, where McAuliffe won by +2.53%, black voter turnout was 20%, exactly identical to the statistic from the GE 2012, and black voters voted with the same intensity for McAuliffe as they did for Obama. So much for the meme that minorities are planning to sit at home in an off year. They came out, they exercised their right to vote. Basta.

Thanks for the kind words, btw.


Again, I don't know what voter intensity levels by party affiliation or race will be in the next two election cycles. I have very actively avoided speculating. Demographics are changing and continue to change.

Virginia is not a bell weather. I have lived here most of my life. Both candidates were very polarizing...Cuccinelli the most. He was terrible. I cannot image him getting elected in too many States. His loss means nothing.

If anything can be taken from the race in Virginia it is the fact McAuliffe nearly blew a 14 point lead against an incredibly polarizing and bad candidate. White's overwhelmingly supported Cuccinelli, it was like a 60-40% split, but believe me, the majority held their noses.

Over 95% of the black electorate in Virginia voted for McAuliffe. That was the difference.
 
Last edited:
Wrong.

There is only a 2 point difference in VT between 2012 and 2004, regardless whether you are talking about comparison to the actual number of registered voters or VAP.

That would not have done it for Romney.

What you are trying to say, if I am correct, is that had the white vote component from 2012 (72%) been the same percentage of the total electorate as in 2004 (77%), then Romney would have won, and that is likely correct.

But the electorate is always changing. Doing a "what, if, were, then, now" scenario after the fact helps little. The GOP knew that this demographic problem was coming at it for a long time.

It is more than likely that the white vote will sink to 71% or 70% in 2016, if historical precedent over many presidential cycles is our guide. Relying on a mammoth white vote to win national elections is no longer an option for the GOP.


Wrong.


You obvious didn't read the link I posted. The supposition I posted was not my analysis. Here is exactly what was said.


With 2004 Turnout Levels: Republicans win in 2012 but not 2016

To assess the impact of turnout alone on the 2012 election I assumed that the national electorate had the size and racial and ethnic composition of the new Census survey and applied to it the more “Republican favorable” turnout rates of 2004 for each racial and ethnic group, as shown in Figure 2. This of course resulted in more white voters and fewer minority voters than actually occurred in 2012. To these voter populations, I applied the actual 2012 voting margins as shown in Figure 3. The result of this exercise was a small 2012 Romney win of 9,000 votes—a virtual tossup. Thus it might be said that the high minority and low white turnout rates of 2012 were responsible for Obama taking the national vote, irrespective of the changing demography of the electorate.


Your second point is wrong as well. I already acknowledged the GOP cannot rely on old demographics and will need to pry away more minority voters. Please read more carefully. Thanks.


Wasn't trying to offend in any way. I read the link before I posted. I do think you did not mean VT as an overall statistic, but rather, the white component, which is actually what that article means (please see the red in the bolded above). So, I think we are squabbling over semantics. But a win of 9,000 votes nationally?? Horror, oh horror. Egads.... thank God that did not happen! Plus, 1876, 1884 and 2000 teach us that with such margins, an electoral backfire is very possible.

Imagine an election night where is it so close, that 35 states could not be called for 5 days or so.... igit...


Stat...I love analysis (you obviously do as well). I thought you were assuming I was pulling shit out of my ass. Not the case. :) I will go where the numbers take me. The Repubs have a major demographic challenge ahead of them. They will need to appeal to more minority voters. That is a fact...not opinion. I hate the Republican social issues crap. I have made that clear numerous times. Gay marriage...abortion rights....I have no problem with those things. I have enjoyed this thread because I think your intent was to look at these issues factually and analytically....not emotionally or in a partisan fashion. I think that's great. Carry on.
 
Great analysis and absolutely factual in my opinion. The meme that Republican voters stayed away from the polls is false. They voted heavily. Asian and Hispanic voter tallies were down slightly from 2008, but they still voted in big numbers. Black voter turnout was the highest of any group. Overall, the minority vote put Obama over the top. There is no question of that.

You raise an excellent point about increase in the voter rolls since 2004. My guess is the expansion has largely been in minority voting ranks which obviously benefits the Dems. The article I posted said Republicans will need to pry away some of these voters in the next two election cycles. That appears to be happening among Hispanic voters according to recent polling. Will it be enough? I don't know. And again, I don't think anyone clearly knows true voter intensity by party affiliation. All of those variables will be critical.


Yes, I agree. But Obama's take of the white vote is actually higher than for a number of other Democrats in history. Of course, they lost in major landslides. If I recall correctly, you need to go back to 1964 to find a Democrat who won the White vote in a national election.

2004 also proved that a massive influx of new voters from one cycle to the next doesn't necessarily mean that it helps the Democrats. The lion's share of those new voters from 2000 to 2004 went for President Bush! And while my Democratic friends in 2004 kept saying that Kerry would win, I kept looking at the state polling and kept seeing too much weakness for Kerry where he should not be weak. I also predicted that Bush would win with 286 EV, but predicted +2.2% margin (he won with +2.46%).

However, in 2008, the lion's share of new voters, the influx from 2004 to 2008, were indeed for then-Senator Obama.

When you look at a presidential election, ignore the national numbers initially and look only at the battle on the ground in the 50 states. And above all else, look at the margins in Ohio - the oldest and most reliable belllwether of the nation, and now, Virginia - the new bellwether of the nation.

You are also correct that the asian and AI vote actually receded somewhat and I am 100% sure that 50% of this has to do with NYC and Hurricane Sandy and the other 50% has to do with California, where 500,000 less ballots were cast than in 2008, and predominantly from areas with considerable asian populations. But a slight negative growth rate doesn't mean much. It could be a statistical anomaly and we will have to wait and see how 2016 turns out.

2 things we know absolutely for sure:

-The White vote, in terms of percentage of the overall electorate on election day, continues to shrink. In fact, the white vote has been shrinking for a long, long time.

-The Latino and Black vote, in terms of percentage of the overall electorate on election day, both continue to grow, esp. the Latino vote.

In the most recent VA gubernatorial election, where McAuliffe won by +2.53%, black voter turnout was 20%, exactly identical to the statistic from the GE 2012, and black voters voted with the same intensity for McAuliffe as they did for Obama. So much for the meme that minorities are planning to sit at home in an off year. They came out, they exercised their right to vote. Basta.

Thanks for the kind words, btw.


Again, I don't know what voter intensity levels by party affiliation or race will be in the next two election cycles. I have very actively avoided speculating. Demographics are changing and continue to change.

Virginia is not a bell weather. I have lived here most of my life. Both candidates were very polarizing...Cuccinelli the most. He was terrible. I cannot image him getting elected in too many States. His loss means nothing.

If anything can be taken from the race in Virginia it is the fact McAuliffe nearly blew a 14 point lead against an incredibly polarizing and bad candidate. White's overwhelming supported Cuccinelli, it was like a 60-40% split, but believe me, the majority held their noses.

Over 95% of the black electorate in Virginia voted for McAuliffe. That was the difference.

The bolded: very wise.

By Bellwether, I am referring to presidential politics.

Not only did Virginia go with the Democratic national winner in both 2008 and 2012, the margin in Virginia was also closest to the national margin both times:

2008:

Colorado: Obama +8.95%
USA: Obama +7.26%
Virginia: Obama +6.30%


2012:

Virginia: Obama +3.87% !!
USA: Obama +3.86% !!
Ohio: Obama +2.97%.

In 2012, it just couldn't have gotten any closer between the VA margin and the national margin. Wow.

Hope that info helps.
 

Forum List

Back
Top