Statistikhengst
Diamond Member
- Banned
- #1

This is report no. V, a continuation of the Hillary vs. GOP polling series that I started on March 17, 2013:
Statistikhengst's ELECTORAL POLITICS - 2013 and beyond: Clinton vs. GOP field, 2016 GE, Part I
Here are Part II , Part III and Part IV.
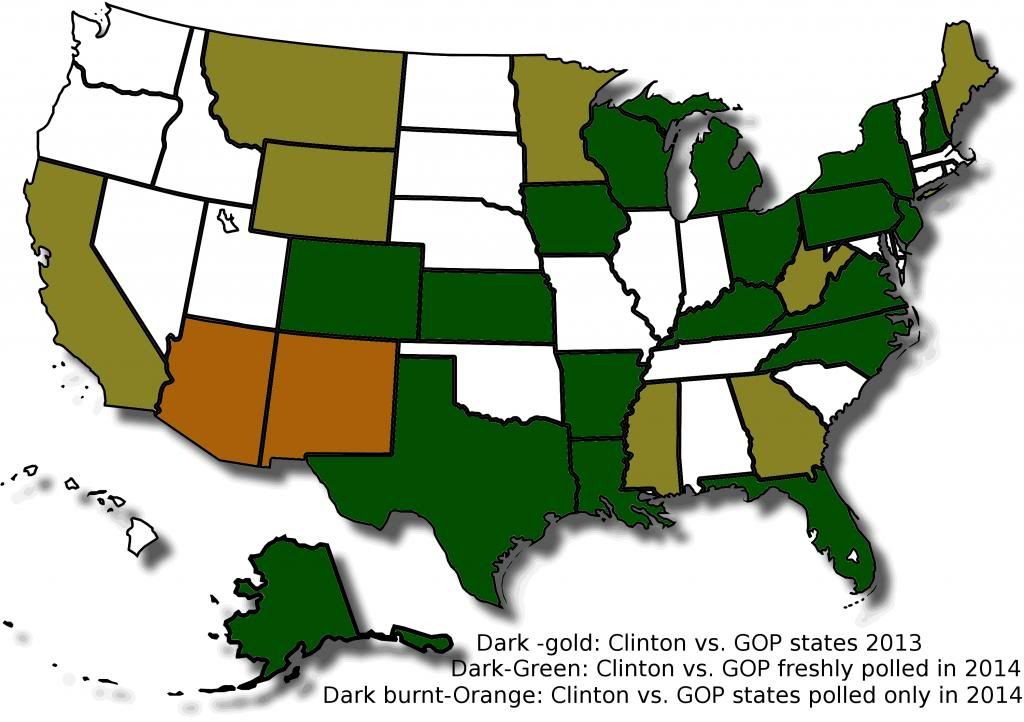
Back in March of 2013, 14 states had been polled. As of August 6th, 2013, it was 21 states. As of now, 28 states have been polled, 27 of which contain presidential match-ups (the lone California poll only has Clinton FAV/UNFAV ratings). Here is how this looks on a map:
As of today, state and national polls together, there have been:
213 polls total, making for 741 presidential matchups.
Hillary Clinton has won 585 of those 741 matchups (78.95%)
The GOP field of various candidates have won 141 of those matchups (19.03%) and there have been15 mathematical ties (2.02%)
So, in spite of the fact that the number of polls has more than doubled in the last ten month and the number of matchups has more than tripled since then, the actual statistic of wins for Hillary Clinton has remained very stable. I would like to show this with three charts, all self-explanatory:
| Report date | no. State polls | no. state matchups | Clinton | GOP | ties | margin |
| 17 Mar 2013 | 15 | 34 | 82.35% | 14.71% | 2.94% | +67.64 |
| 06 Aug 2013 | 40 | 102 | 73.53% | 21.57% | 4.90% | +51.96 |
| 16 Nov 2013 | 58 | 158 | 75.95% | 21.51% | 2.54% | +54.44 |
| 11 May 2014 | 115 | 386 | 75.65% | 21.51% | 2.85% | +54.14 |
| 02 Oct 2014 | 166 | 602 | 74.75% | 22.76% | 2.49% | +51.99 |
| Report date | no. Nat'l polls | no. Nat'l matchups | Clinton | GOP | ties | margin |
| 17 Mar 2013 | 5 | 11 | 100.00% | 0.00% | 0.00% | 100 |
| 06 Aug 2013 | 21 | 38 | 100.00% | 0.00% | 0.00% | 100 |
| 16 Nov 2013 | 25 | 51 | 98.04% | 1.96% | 0.00% | +96.08 |
| 11 May 2014 | 41 | 122 | 96.72% | 3.28% | 0.00% | +93.44 |
| 02 Oct 2014 | 47 | 139 | 97.12% | 2.88% | 0.00% | +94.24 |
| Report date | no. all polls | no. all matchups | Clinton | GOP | ties | margin |
| 17 Mar 2013 | 20 | 45 | 86.67% | 15.55% | 0.22% | +71.12 |
| 06 Aug 2013 | 61 | 140 | 80.71% | 15.72% | 3.57% | +64.99 |
| 16 Nov 2013 | 83 | 209 | 81.34% | 16.75% | 1.91% | +64.59 |
| 11 May 2014 | 156 | 508 | 80.71% | 17.13% | 2.17% | +63.58 |
| 02 Oct 2014 | 213 | 741 | 78.95% | 19.03% | 2.02% | +59.92 |
The column on the left of each table is the report date. One table is only for the state polls/matchups, the second table is for the national polls/matchups and the third table is for all polls combined. Look how very stabile those numbers have remained over more than 1.5 years.
As of today, here is an exact table, by state, with the number of polls, matchups, and who won:
| State | No. of polls | No. of Matchups | Clinton wins | GOP wins | Ties |
| National | 47 | 139 | 135 | 4 | 0 |
| AK | 6 | 30 | 6 | 24 | 0 |
| AR | 4 | 15 | 5 | 10 | 0 |
| AZ | 1 | 5 | 4 | 1 | |
| CA | 1 | 0 | 0 | 0 | 0 |
| CO | 10 | 36 | 21 | 13 | 2 |
| FL | 15 | 51 | 51 | 0 | 0 |
| GA | 2 | 9 | 7 | 1 | 1 |
| IA | 14 | 59 | 52 | 4 | 3 |
| KS | 4 | 16 | 1 | 15 | 0 |
| KY | 5 | 14 | 6 | 7 | 1 |
| LA | 7 | 27 | 10 | 14 | 3 |
| ME | 1 | 4 | 4 | 0 | 0 |
| MI | 9 | 30 | 30 | 0 | 0 |
| MN | 2 | 9 | 9 | 0 | 0 |
| MS | 2 | 9 | 0 | 8 | 1 |
| MT | 3 | 8 | 0 | 7 | 1 |
| NH | 9 | 26 | 25 | 1 | 0 |
| NJ | 9 | 18 | 17 | 1 | 0 |
| NM | 1 | 6 | 6 | 0 | 0 |
| NY | 7 | 11 | 11 | 0 | 0 |
| NC | 12 | 47 | 41 | 6 | 0 |
| OH | 6 | 33 | 32 | 0 | 1 |
| OR | 1 | 5 | 5 | 0 | 0 |
| PA | 8 | 34 | 33 | 1 | 0 |
| TX | 4 | 18 | 5 | 13 | 0 |
| VA | 15 | 45 | 43 | 1 | 1 |
| WV | 1 | 5 | 0 | 5 | 0 |
| WI | 5 | 24 | 23 | 0 | 1 |
| WY | 1 | 5 | 0 | 5 | 0 |
| Latino | 1 | 3 | 3 | 0 | 0 |
| TOTAL state polls | 166 | 602 | 450 | 137 | 15 |
| TOTAL state and national | 213 | 741 | 585 | 141 | 15 |
| % state polls only | 74,75% | 22,76% | 2,49% | ||
| % state and nat'l together | 78,95% | 19,03% | 2,02% | ||
Here is a screenshot of an example of the layout of this table, using the state of Florida as an example:

You will notice that the polls are numbered in reverse chronological order, with the latest poll at the top. All polls are linked, so you can click on the link for every single poll and see the results for yourself. The release date of the poll (European dating system) is then following by the survey size and MoE (Margin of Error). Then, if there are any FAV/UNFAV numbers or DEM nomination figures, they come next.
The Presidential matchups follow in this order:
Clinton vs. Christie
Clinton vs. Paul
(at the point the screenshot shows no more, you would have to scoll out at the excel table to see the rest)
Clinton vs. Ryan
Clinton vs. Cruz
Clinton vs. Bush, J.
Clinton vs. Rubio
Clinton vs. Huckabee
And then, any other GOP candidates that have been polled in that particular state.
The numbers are COLOR CODED (blue = DEM / red = GOP) and bolded = the higher value. Wherever you see values in italic, that means a mathematical tie.
The following 31 pollsters have polled Hillary vs. GOP matchups thus far:
Quinnipiac
Rasmussen
NBC (Princeton)
PPP (D)
Monmouth
Marist / McClatchy
Gallup
Bloomberg
YouGov
CNN / ORC
ABC / WAPO
The Field Poll
Gravis (R)
WMUR / UNH
Harper (R)
Purple Strategies
Marquette University Poll
Latino Decisions
The Arkansas Poll
The Polling Company
Conservative Intel
Magellan
MRG (R)
Dartmouth
Rutgers/Eagleton
Siena
Roanoke
Loras College
EPIC/MRA
Farleigh-Dickinson
Civitas (R)
Here is a map of those states that have been polled, colored by the winner of the majority of the match-ups. In the case of Colorado and Kentucky it's really quite close, so I am leaving both states green for now.
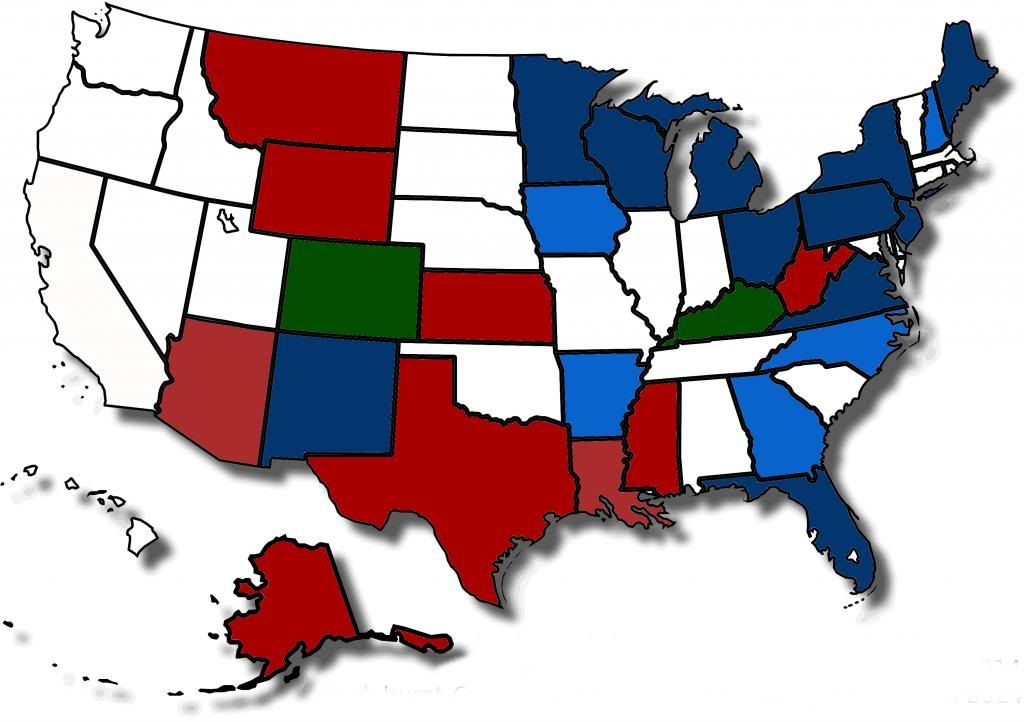
This map is NOT a prediction map. It only shows who has won the majority of matchups. And interestingly enough, it has not changed even one bit since the last report - from May, 2014.
What to make of all of this?
Well, it's still early, but the trend we have seen all through 2013 has continued through 2014, namely, that Hillary Clinton is demonstrably ahead in the battleground states that have decided the last 6 elections cycles. Not only is she ahead in those states, she is decisively ahead. And in states where the GOP is winning, the aggregate margins are reduced.
1.) The Quntifecta: Florida (29 EV), Pennsylvania (20 EV) Ohio (18 EV), North Carolina (15 EV) and Virginia (13 EV). Total EV: 95
In every one of those 5 states, Hillary is considerably ahead of her potential GOP opponents.
In Virginia, one of the most polled states thus far (here is the EXCEL tab for Virginia), there have been 15 polls with 45 matchups. Hillary has won 43 of them, there was one tie and Christie won one matchup in a poll from 2013 that I missed and just included in the statistic (Washington Beacon Poll). All said and told, Hillary is at between +4 and +14 against GOP candidates, all margins larger than Obama's 2012 win.
In Florida, the third most polled state thus far (here is the EXCEL tab for Florida), there have been 15 polls with 51 matchups and Hillary has won every single matchup, with the majority of the margins in the double digits. No Democratic candidate that I know of has scored these type of margins in Florida in modern polling history. Not even Bill Clinton scored these kinds of numbers.
The kind of polling we are seeing out of Florida and Virginia should be the no. 1 warning sign for the GOP.
In North Carolina, (here is the EXCEL tab for North Carolina), there have been 12 polls and 47 matchups, of which Hillary Clinton has won 41. A strike against this data is that all of the polls have been from PPP (D) and I would much prefer to see a broad base of pollsters, as is the case with Virginia and Florida. The margins are also smaller, but consistent. PPP (D), which is based in North Carolina, nailed the polling in 2008, but called a tie in NC in 2012, where Romney won by +2.04%, so PPP (D) missed it in 2012. Alone the fact that this state is still unbelievably competitive is a bad sign for the GOP.
In Ohio, somewhat less polled than the others, (here is the EXCEL tab for Ohio), there have been 6 polls and 33 matchups, of which Hillary has won 32. And in 14 of those 32 wins, Hillary is winning with double digit margins over her opponents. The last time a Democrat won Ohio with more than a single digit margin: LBJ, 1964. Before that? FDR, 1936. Both of those elections were massive blowout elections for the Democratic Party. Bill Clinton barely won Ohio in 1992, but he won it by +6 in 1996. Obama won it by +4.6 in 2008 and by +3 in 2012. There has not been a poll of Ohio since 1988 to show a candidate of any party in double digits. This is an extremely important data point to remember. Again, it's not just one poll or one matchup where she is winning with double digits: it's in 14 matchups spread out over 4 polls.
In Pennsylvania, also one of the less polled states, (here is the EXCEL tab for Pennsylvania), there have been 8 polls and 34 matchups, Hillary has won 33 of them. And, similar to Ohio, 23 of those 33 wins are double-digits wins. Here, Christie still does the best of the GOP field.
So, of the Quintifecta, we have four of five states (VA, OH, FL, PA) where, if the double-digit margins hold like this, those states will not even be true battlegrounds on election day 2016.
2.) Clinton is showing considerable strength in some of the so-called "Clinton 6 states". The "Clinton 6", as I call them, are the six southern -or- Mason-Dixon states that Bill Clinton won in both 1992 and 1996, states that Obama never won. They are: WV, KY, MO, AR, LA and TN. I dida write upover this phenomenon in November 2012.
Four of those states have been polled: WV, KY, LA and AR.
There is only one poll out of West Virginia, but it confirms that the massive Romney landslide victory of 2012 is likely to hold for any Republican in 2016.
However, in Kentucky, it really could be a horserace (Bill Clinton won the Bluegrass state twice), and in Arkansas (the former home-state of the Clintons), we now have a fourth poll showing a tight single-digit, except against fellow home-stater Mike Huckabee.
To note, Mitt Romney won West Virginia by +27 and Arkansas by +24 and also made little known electoral history in 2012 as being the first Republican ever for whom both of these erstwhile Democratic bastions were called for a Republican immediately at poll closing time, but the Clinton polling here is divergent: she is losing in WV but winning somewhat in AR. However, she is under 50 in AR, there are lots of undecideds and things could change again. I have personally been thinking that Hillary would have better chances in Missouri, a state where Obama and McCain practically tied in 2008, but Romney won handily in 2012, than in Arkansas. Wait and see.
One of the advantages of such an interesting 2014 mid-term election season is that some states that are rarely polled for presidential elections are getting attention right now, including the great state of Louisiana, which has now been polled 7 times and with 27 matchups, of which Hillary was won 10 matchups and the GOP candidates have won 17. More importantly, in most all matchups, it is a close single-digit race. In the last PPP poll of Louisiana, the margins went from Hillary +4 over Christie to Huckabee +7 over Hillary.
3.) Individual states that had been battlegrounds in 2000, 2004 and to some extent, in 2012, look very solid for Clinton: Wisconsin, Minnesota, Michigan, New Mexico and New Hampshire.
In the West, also part of a very consistent pattern, Clinton is struggling mightily in Colorado, she has the entire time. If there is a state that the GOP has the best chances of regaining from 2008-2012, it is probably the Rocky Mountain State. Wait and see. There have now been 10 polls of Colorado and 36 matchups, of which Hillary has won 21, the GOP has won 13 and there were two mathematical ties.
It also appears to be close in Iowa, but Clinton is winning.
In the state of New York, an expected blue state, Clinton has margins upwards of +40. The last (and only) time a Democrat won NY with circa +40? LBJ, 1964.
Likewise, the GOP is easily winning Wyoming, by an average of about +27. George W. Bush (43) won Wyoming with over +40 both times.
Now, you might say: "Why quote NY and WY? NY is going to go blue and WY is going to go red!" And I will say: "a rising tide lifts all boats".
Expanded margins for Clinton in expected blue states and suppressed losing margins for her in expected RED states would point to a national win for her.
Speaking of red states, here is a surprise red state for you: KANSAS. In the great state of Kansas, there have now been 4 polls and 16 matchups, of which the GOP has won 15 and Hillary has won 1, but the margins are interesting. Here is a screenshot of part of the Kansas numbers:
Indeed, in Kansas, it is a narrow single-digit race right now. Is it likely to stay that way? Probably not. But Kansas is supposed to be a +20 to +30 RED state.
4.) Speaking of national win: national polling is overwhelmingly pointing to a large Clinton win:
There have been 47 national polls, with 139 matchups. Hillary Clinton has won 135 (97.12%) of those matchups. Go click on the link and see for yourself how many of those margins are double digit margins.
Now, varying from state to state, one GOPer may come closer to Clinton than the others, but she beats them all, consistently. And this data is coming from many various and independent-from-each-other pollsters. Rasmussen, a Right-Leaning outfit, recently put out a poll showing Hillary Clinton with a +13margin over Jeb Bush nationally.
5.) My wish-list: there are some states for which we have no data right now and it would be very enlightening to get some data from state states, for instance, Missouri, which used to be quite a bellwether state in our Union (until 2008), and Nevada, which was considered a battleground in 2008 and in 2012. Also, from the 9.25 Obama pick-ups from 2008, it would be good to see data from Indiana, which went for Obama by +1.03% and then swung back to the Republicans with Romney by +10.20%. However, Indiana has been traditionally a solid +20 RED state, so indeed it would be interesting to see how Hillary does in rural areas in such a state. My wish would also to see more polling outside of PPP (D) and Quinnipiac.
----------------------------------------------------------------------
Facit: it's Hillary's election to have, if she wants it. If she declares (and I am more than reasonably sure she will declare), then she is the prohibitive front runner both for her party's nomination and also against any and all comers from the GOP.
Factors working against the GOP are the fact that Obama literally cemented Virginia into the Democratic column by winning the state not just once, but twice, against all conventional wisdom. Another factor against the GOP was the wild swing of Cuban-American voters in Florida from the GOP to Obama in 2012. The assumption is that this is due to the ongoing immigration debate. Another factor is the name "Clinton", where both Hillary and former President Bill Clinton are extremely well-known to the American public and in spite of the Lewinski scandal, Bill Clinton is still quite respected among the American public.
If Hillary only wins the states that were common DEM states between Bill Clinton and Barack Obama, then she is already at 290 EV (shown in the Clinton 6 link above, here is the link again). I see a real possibility for Hillary Clinton to go slightly over 400 EV in 2016.
Those are the current polling statistics. Update in January/February 2015. Starting with the next analysis, I will be publishing electoral maps for Hillary against potential GOP opponents by name.
Full disclosure: I am a Clinton supporter, but were the numbers to be showing the GOP running away with this race, I would report it with exactly the same veracity.
")