http://nsstc.uah.edu/climate/2010/december/12_10GTR.pdf
Jan. 6, 2011
Vol. 20, No. 8
For Additional Information:
Dr. John Christy, (256) 961-7763
john.christy@nsstc.uah.edu
Dr. Roy Spencer, (256) 961-7960
roy.spencer@nsstc.uah.edu
Global Temperature Report: December 2010
2010 finishes in a statistical tie
as the warmest year in the past 32
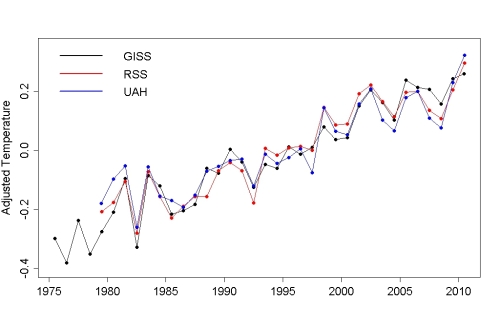
Global climate trend since Nov. 16, 1978: +0.14 C per decade
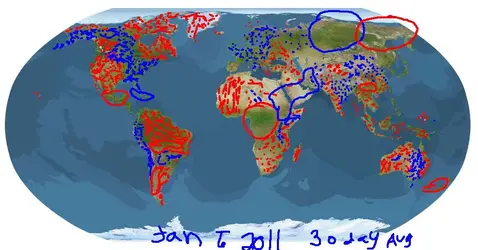
December temperatures (preliminary)
Global composite temp.: +0.18 C (about 0.32° Fahrenheit) above 30-year average for December.
Northern Hemisphere: +0.21 C (about 0.38° Fahrenheit) above 30-year average for December.
Southern Hemisphere: +0.15 C (about 0.26° Fahrenheit) above 30-year average for December.
Tropics: -0.22 C (about 0.40° Fahrenheit) below 30-year average for December.
November temperatures (revised):
Global Composite: +0.27 C above 30-year average
Northern Hemisphere: +0.37 C above 30-year average
Southern Hemisphere: +0.17 C above 30-year average
Tropics: -0.12 C below 30-year average
(All temperature anomalies are based on a 30-year average (1981-2010) for the month reported.)
Notes on data released Jan. 6, 2011:
2010 finished in a photo finish with 1998 for the warmest year in the 32-year satellite temperature
record, according to Dr. John Christy, professor of atmospheric science and director of the
Earth System Science Center at The University of Alabama in Huntsville. 2010 was only 0.013 C
cooler than 1998, an amount that is not statistically significant.
Both 1998 and 2010 were years in which an El Nino Pacific Ocean warming event raised temperatures
around the globe. In recent months a La Nina Pacific Ocean cooling event has been
building;
temperatures in the tropics were cooler than seasonal norms for both November and
December.
Annual Global Average Anomaly
(Warmest to Coolest)*
1. 1998 +0.424 C
#2. 2010 +0.411 C
3. 2005 +0.251 C
4. 2002 +0.220 C
5. 2009 +0.187 C
6. 2003 +0.185 C
7. 2006 +0.175 C
8. 2007 +0.168 C
9. 2001 +0.112 C
10. 2004 +0.104 C
11. 1991 +0.025 C
12. 1987 +0.018 C
12. 1995 +0.018 C
14. 1988 +0.017 C
15. 1980 -0.003 C
16. 1990 -0.017 C
*Compared to 30-year seasonal norms
The globe continues to warm unevenly, with warming increasing as you go north: The Arctic
Ocean has warmed an average of 1.66 C (about 2.99 degrees Fahrenheit) in the past 32 years. By
comparison, the Antarctic continent has cooled about 0.29 C (more than half a degree Fahrenheit)
during the same time.
The continental, contiguous U.S. has warmed by about 0.67 C (about 1.21 degrees Fahrenheit)
since 1979.
17. 1981 -0.040 C
18. 2008 -0.041 C
19. 1997 -0.044 C
20. 1999 -0.051 C
21. 1983 -0.056 C
21. 2000 -0.056 C
23. 1996 -0.071 C
24. 1994 -0.104 C
25. 1979 -0.165 C
26. 1989 -0.202 C
27. 1986 -0.239 C
28. 1993 -0.240 C
29. 1982 -0.245 C
30. 1992 -0.284 C
31. 1985 -0.304 C
32. 1984 -0.348 C
Climate trends since November 1979
(Degrees C per decade)
Globe Land Ocean
+0.14 +0.18 +0.12
NH Land Ocean
+0.21 +0.24 +0.17
SH Land Ocean
+0.08 +0.07 +0.08
Trpcs Land Ocean
+0.08 +0.10 +0.07
(The tropics extend from 20° N to 20° S latitude)
NoExt Land Ocean
+0.27 +0.28 +0.25
(NoExt goes from 20° N to 85° N latitude)
SoExt Land Ocean
+0.07 +0.04 +0.08
(SoExt goes from 20° S to 85° S latitude)
NoPol Land Ocean
+0.47 +0.44 +0.52
(The North Polar region is from 60° N to 85° N latitude)
SoPol Land Ocean
-0.07 -0.09 -0.06
(The South Polar region is from 60° S to 85° S latitude)
USA48
+0.21
Technical Note:
Beginning with this Global Temperature Report, the baseline period used to determine seasonal
norms changes. It has been the 20-year (1979 to 1998) period at the beginning of the satellite
record. Starting this month the report will use a new 30-year (1981 to 2010) reference average to
match the climatological period normally used with climate data by the U.N.’s World Meteorological
Organization.
“This will not affect the long term trend, which is the most important of the numbers we produce,
but will ‘reshuffle’ anomalies to reflect the new base period,” said Christy.
Higher resolution color maps of local temperature anomalies may soon be available on-line at:
Global Temperature Report
The processed temperature data is available on-line at:
vortex.nsstc.uah.edu/data/msu/t2lt/uahncdc.lt
As part of an ongoing joint project between UAHuntsville, NOAA and NASA, Christy and Dr.
Roy Spencer, a principal research scientist in the ESSC, use data gathered by advanced microwave
sounding units on NOAA and NASA satellites to get accurate temperature readings for
almost all regions of the Earth. This includes remote desert, ocean and rain forest areas where
reliable climate data are not otherwise available.
The satellite-based instruments measure the temperature of the atmosphere from the surface up
to an altitude of about eight kilometers above sea level. Once the monthly temperature data is
collected and processed, it is placed in a “public” computer file for immediate access by atmospheric
scientists in the U.S. and abroad.
Neither Christy nor Spencer receives any research support or funding from oil, coal or industrial
companies or organizations, or from any private or special interest groups. All of their climate
research funding comes from federal and state grants or contracts.
The tropics where -.12c below the 30 year avg. That means the Nina had a huge ******* amount of effect on earths temperature out come in 2010. 1998 only had a very tiny Nina in the very end.