wirebender
Senior Member
How do you prove there's no measured decrease? Since we know CO2 absorbs IR and we know it's been increasing, either the measurements are flawed or we haven't been taking space data long enough. Either way, your statement is a long way from being proven and it certainly doesn't meet the logic test.
And here, yet again, you expose your extrordinary ignorance of the topic. You really don't know how one might measure the amount of LW radiation leaving the atmosphere?
Here konradv, I have posted this all before, but I will post it again. The data cover a period from 1970 to 2006. During that 38 year interval, atmospheric CO2 increased considerably. Rather than type the whole thing out again, I will simply cut and paste it from the original.
If AGW theory were correct and increasing atmospheric CO2 caused warming, it would happen because the increased CO2 would capture more long wave radiation in the 2.7, 4.3, and 15 micrometer wavelengths. That means that if one took a snapshot of the outgoing long wave radiation in say 1970 and another snapshot of the outgoing long wave radiation at a later date when more atmospheric CO2 was present, less outgoing long wave radiation in the 2.7, 4.3, and 15 micrometer wavelenghts would prove the basis of AGW theory. An equal or greater amount of outgoing longwave radiation in those wavelengths would disprove the basis for AGW theory as it would indicate that even though more atmospheric CO2 were present, no more long wave radiation was being absorbed by that increased CO2. Well, guess what?
Here is an overlay of snapshots of outgoing long wave radiation taken in 1970 by the sattellite IRIS and in 1997 by the sattellite IMG in 1997. Both snapshots were taken over the central pacific at the same time of the year and under the same conditions.
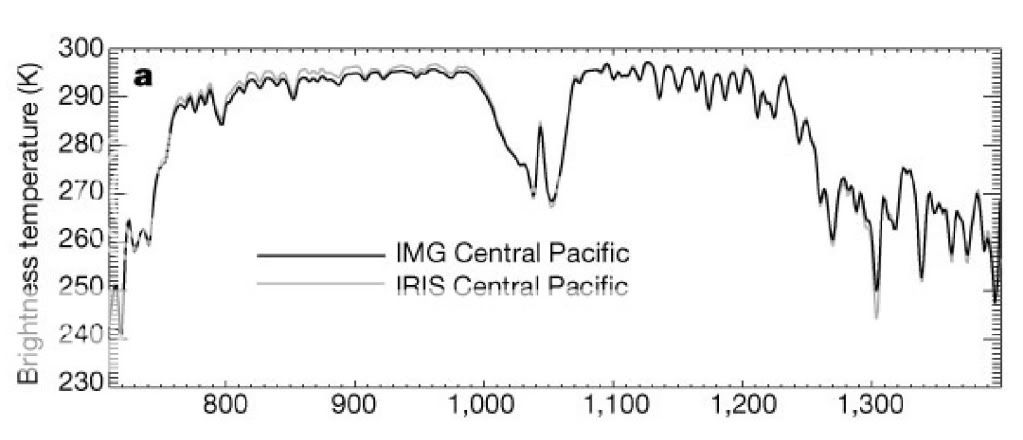
The X axis of the graph indicates wavelengths. The wavelengths that CO2 absorbs, remember are 2.7, 4.3, and 15 micrometers. All found on the far left side of the graph. The light colored line is the IRIS data collected in 1970 and the darker line is the IMG data from 1997. If AGW theory were correct, the IMG data from 1997 should show less outgoing longwave radiation than the IRIS data from 1970 as there is certainly more CO2 in the atmosphere in 1997 than there was in 1970. As you can see, the longwave radiation from the two separate snapshots is identical indicating no additional absorption of outgoing longwave radiation in the CO2 wavelengths even though there is more CO2 in the atmosphere.
The next two images were taken by IRIS in 1970 and TES in 2006 respectively. In these graphs, the black line represents the actual measurement taken by the sattellite, the red line represents what the climate models predict and the blue line represents the difference between the model data and the actual data.
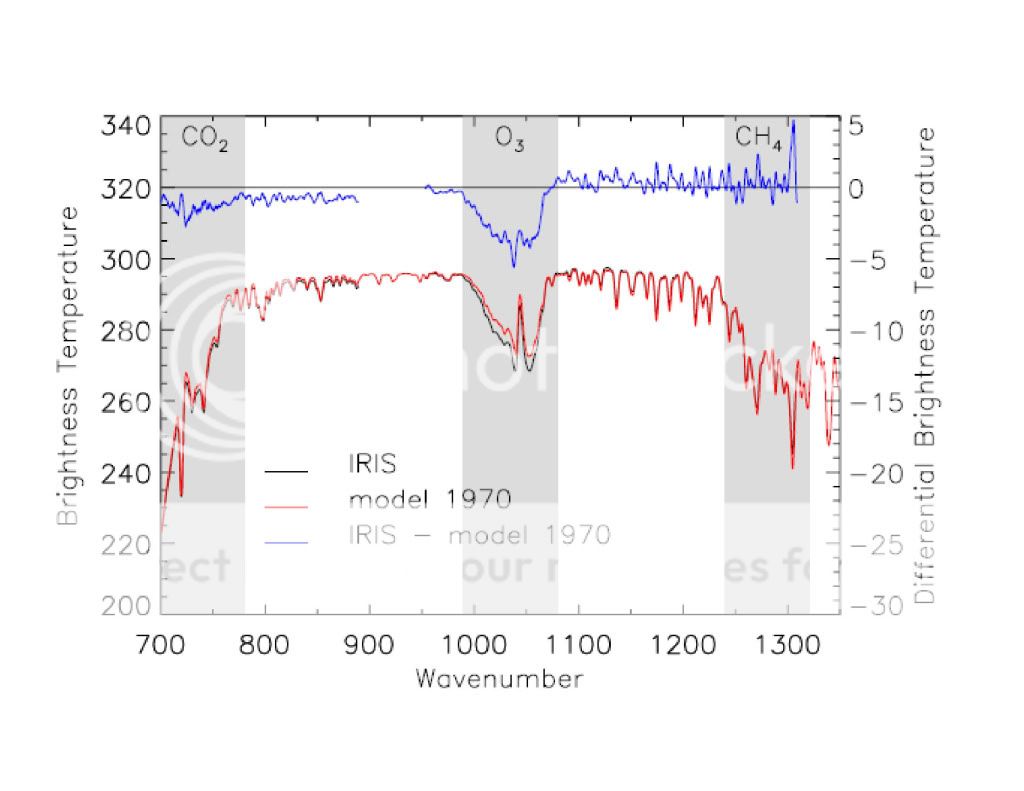
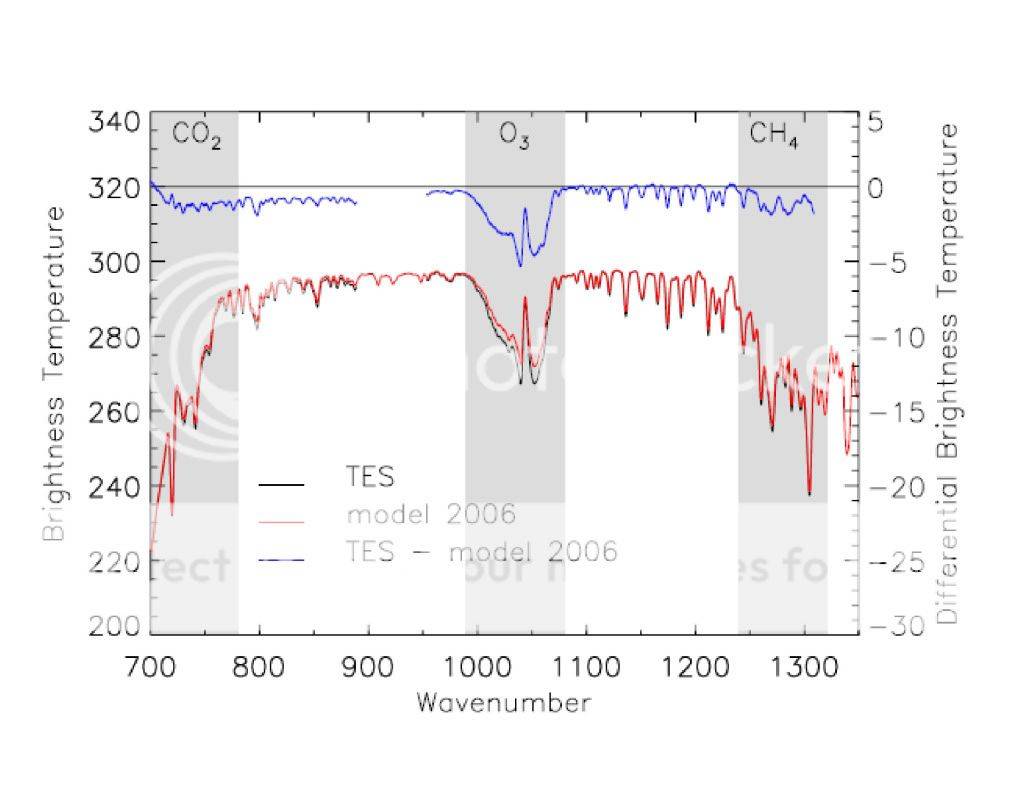
Feel free to print out the two graphs and overlay them. You will find that the black lines (actual measured data) are identical indicating this time, that there is no difference between outgoing longwave radiation in the CO2 absorption spectrum between 1970 and 2006. Again, if AGW theory were correct, then the outgoing longwave radiation should be less as the blue lines on the graphs indicate. As you can see, this is not the case. There has been no increase in the absorption of outgoing longwave radiation in the CO2 spectrum between 1970 and 2006 in spite of the presence of more atmospheric CO2.
 .........FTMFW!!!

